New Zealand’s COVID response ~ one GISer’s perspective

David O’Sullivan

Geospatial Stuff

University of Auckland

The big picture

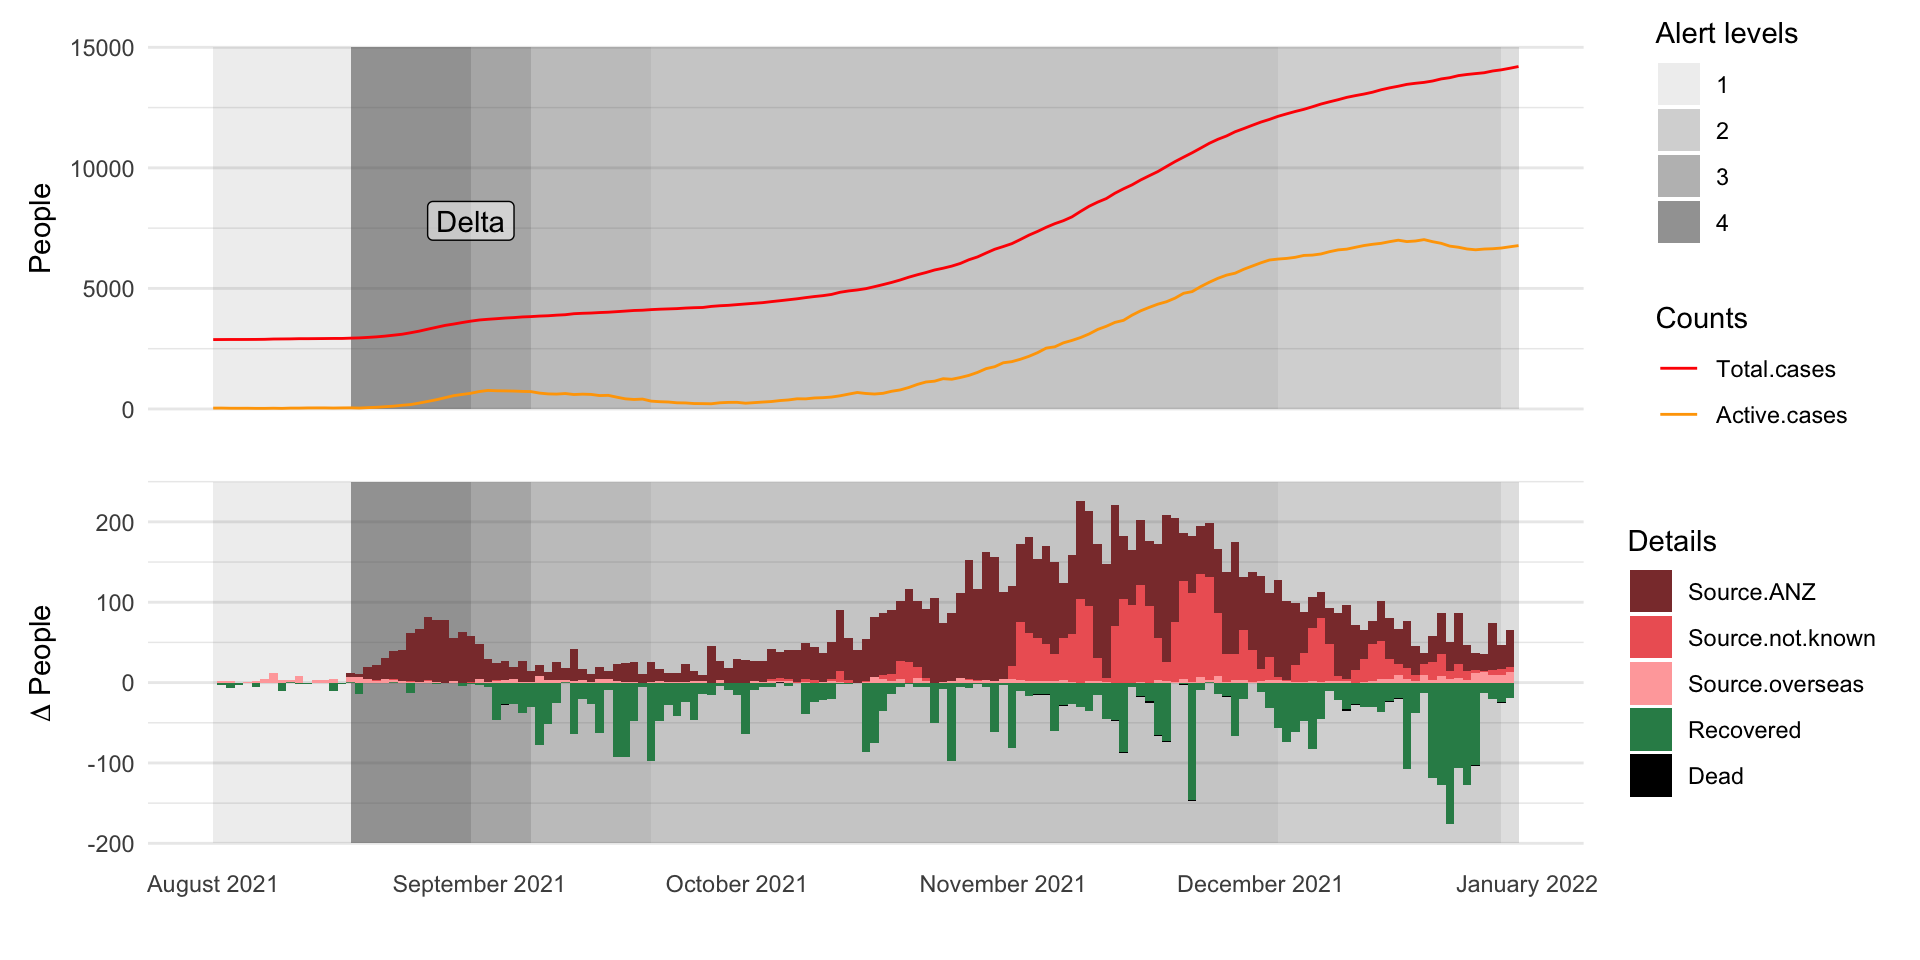
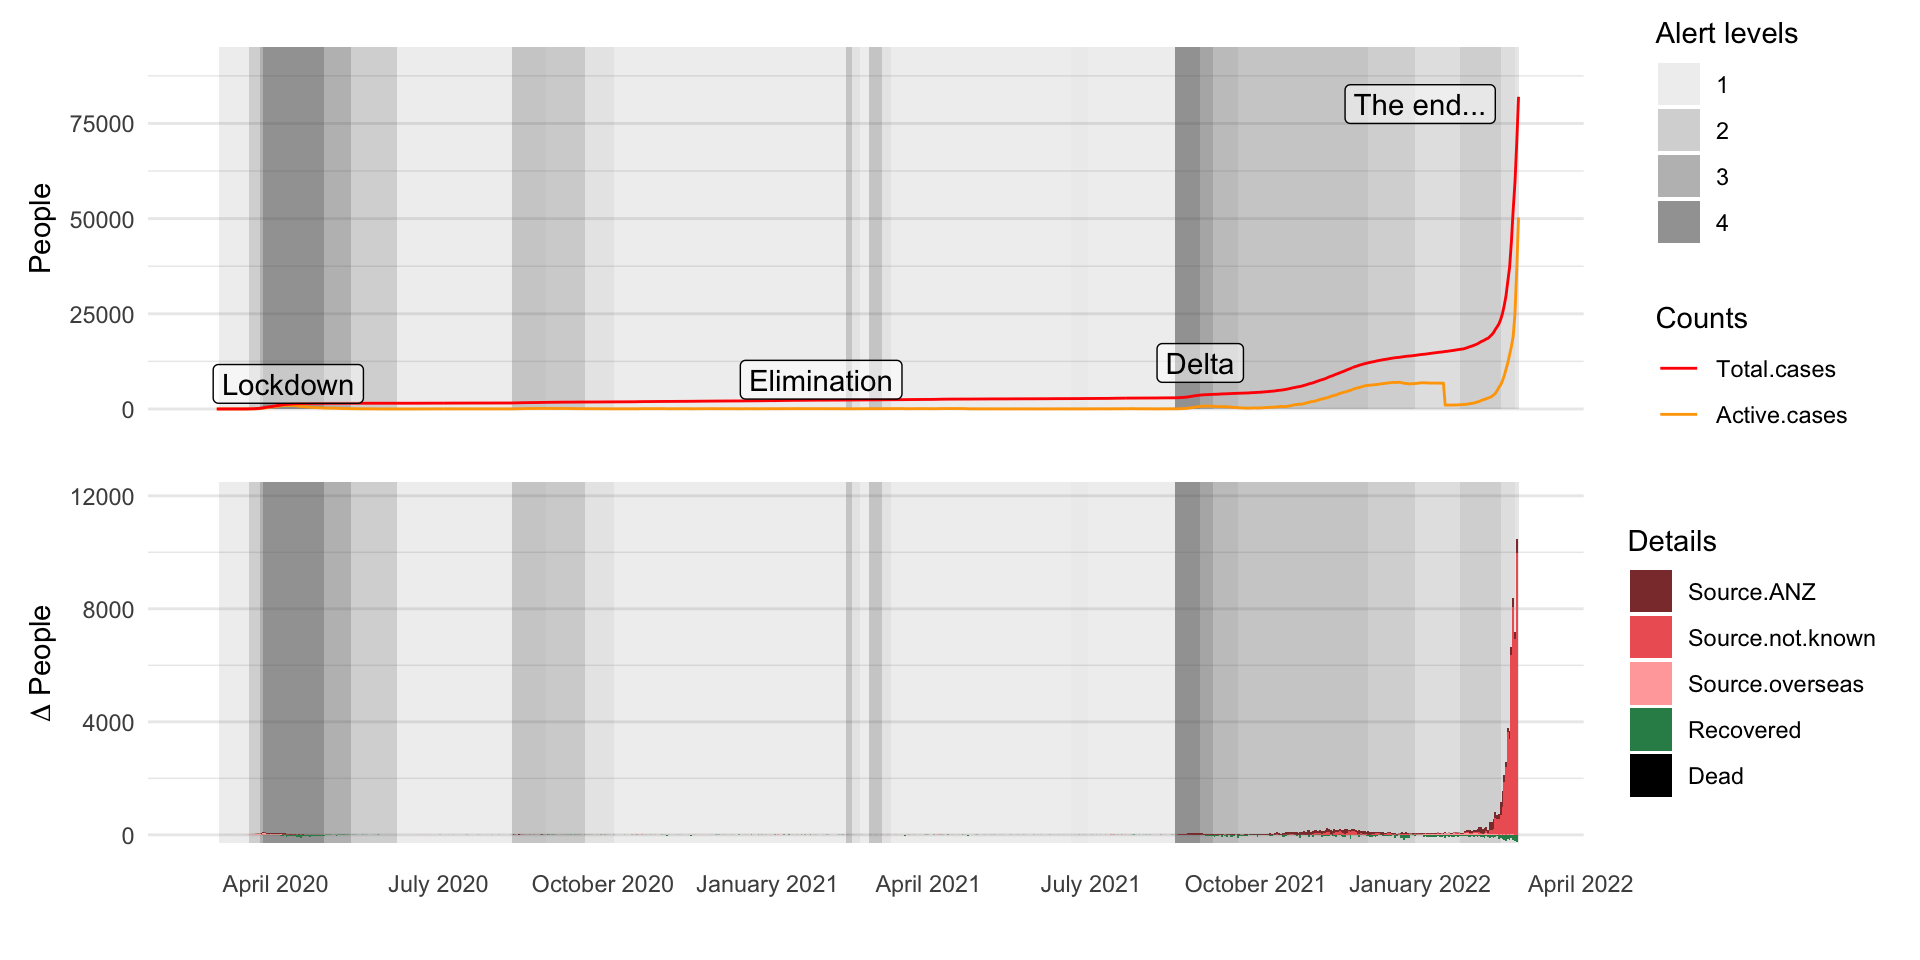
  • Daily hand-entered data from government website
  • (My) first serious exploration of the R tidyverse and the ggplot visualization library
  • Confirmed a decision to transition ‘advanced GIS’ to ‘intro spatial data science’
  • Biggest challenge was data buried in proprietary systems

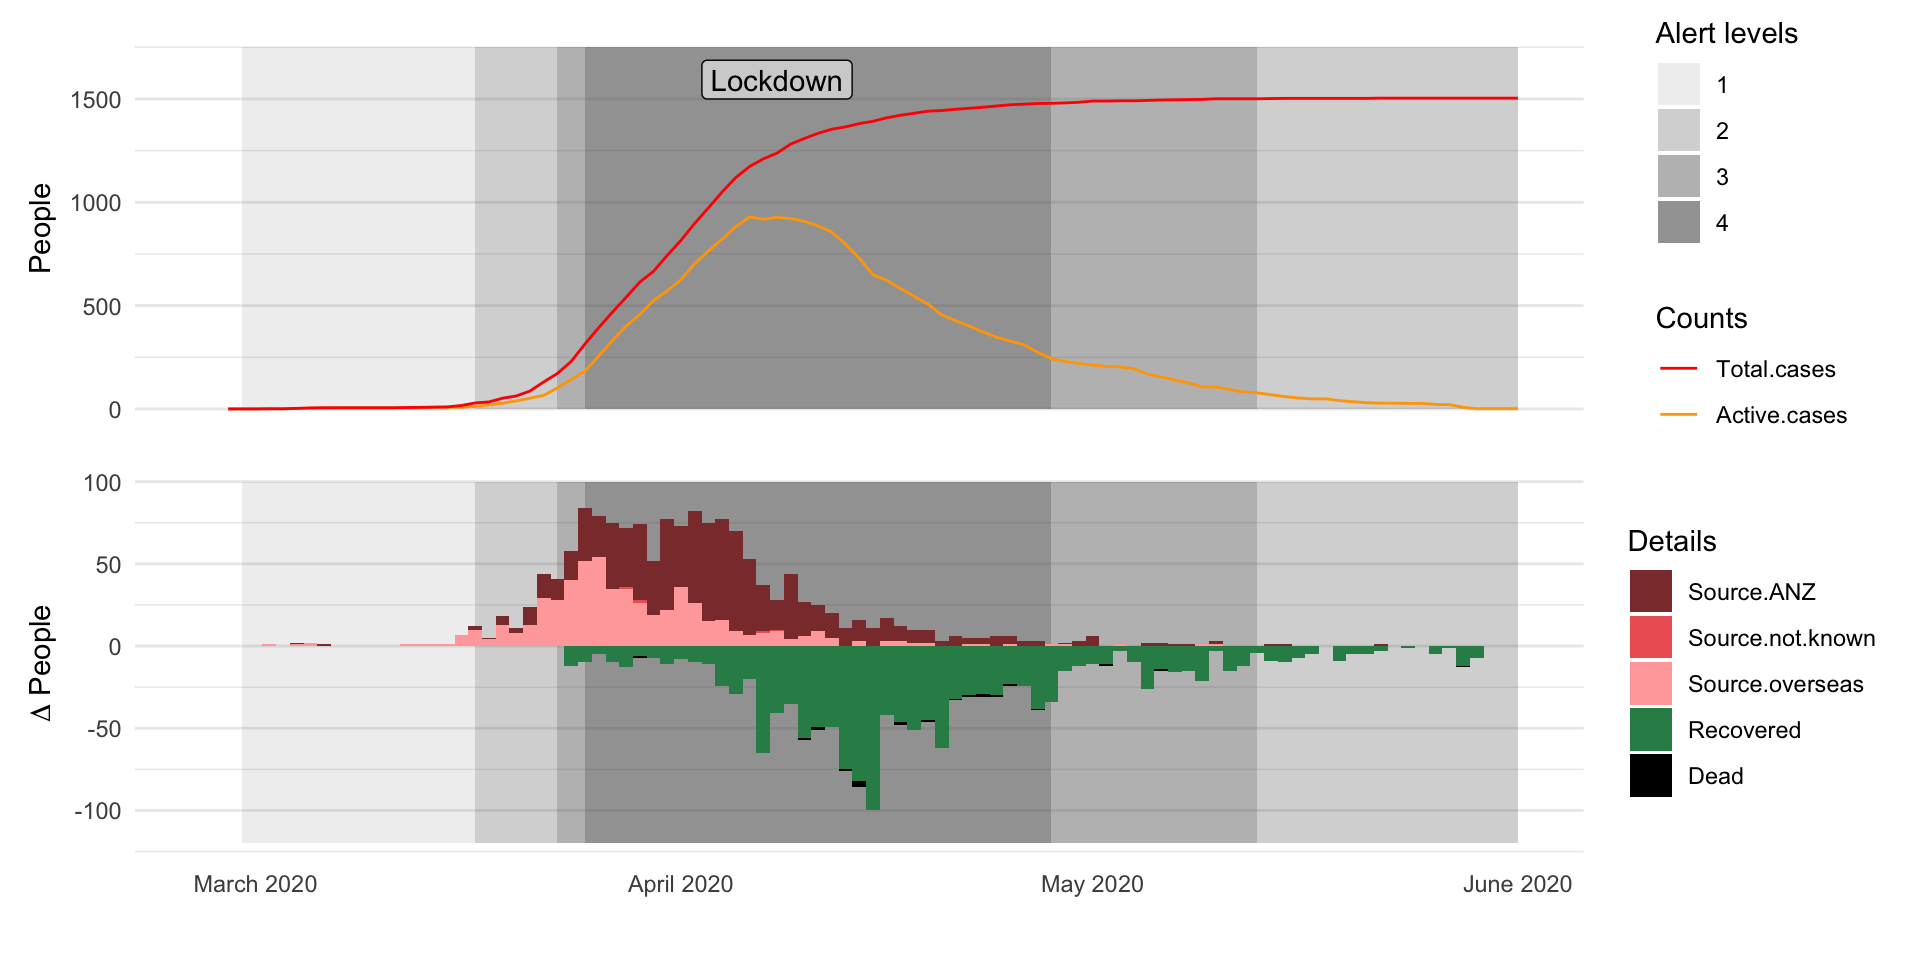
Lockdown

“The team of five million”


Lockdown rush hour traffic SH16, Auckland
from commons.wikimedia.org
by Megan Harvey

Modelling the pandemic

(From my basement)

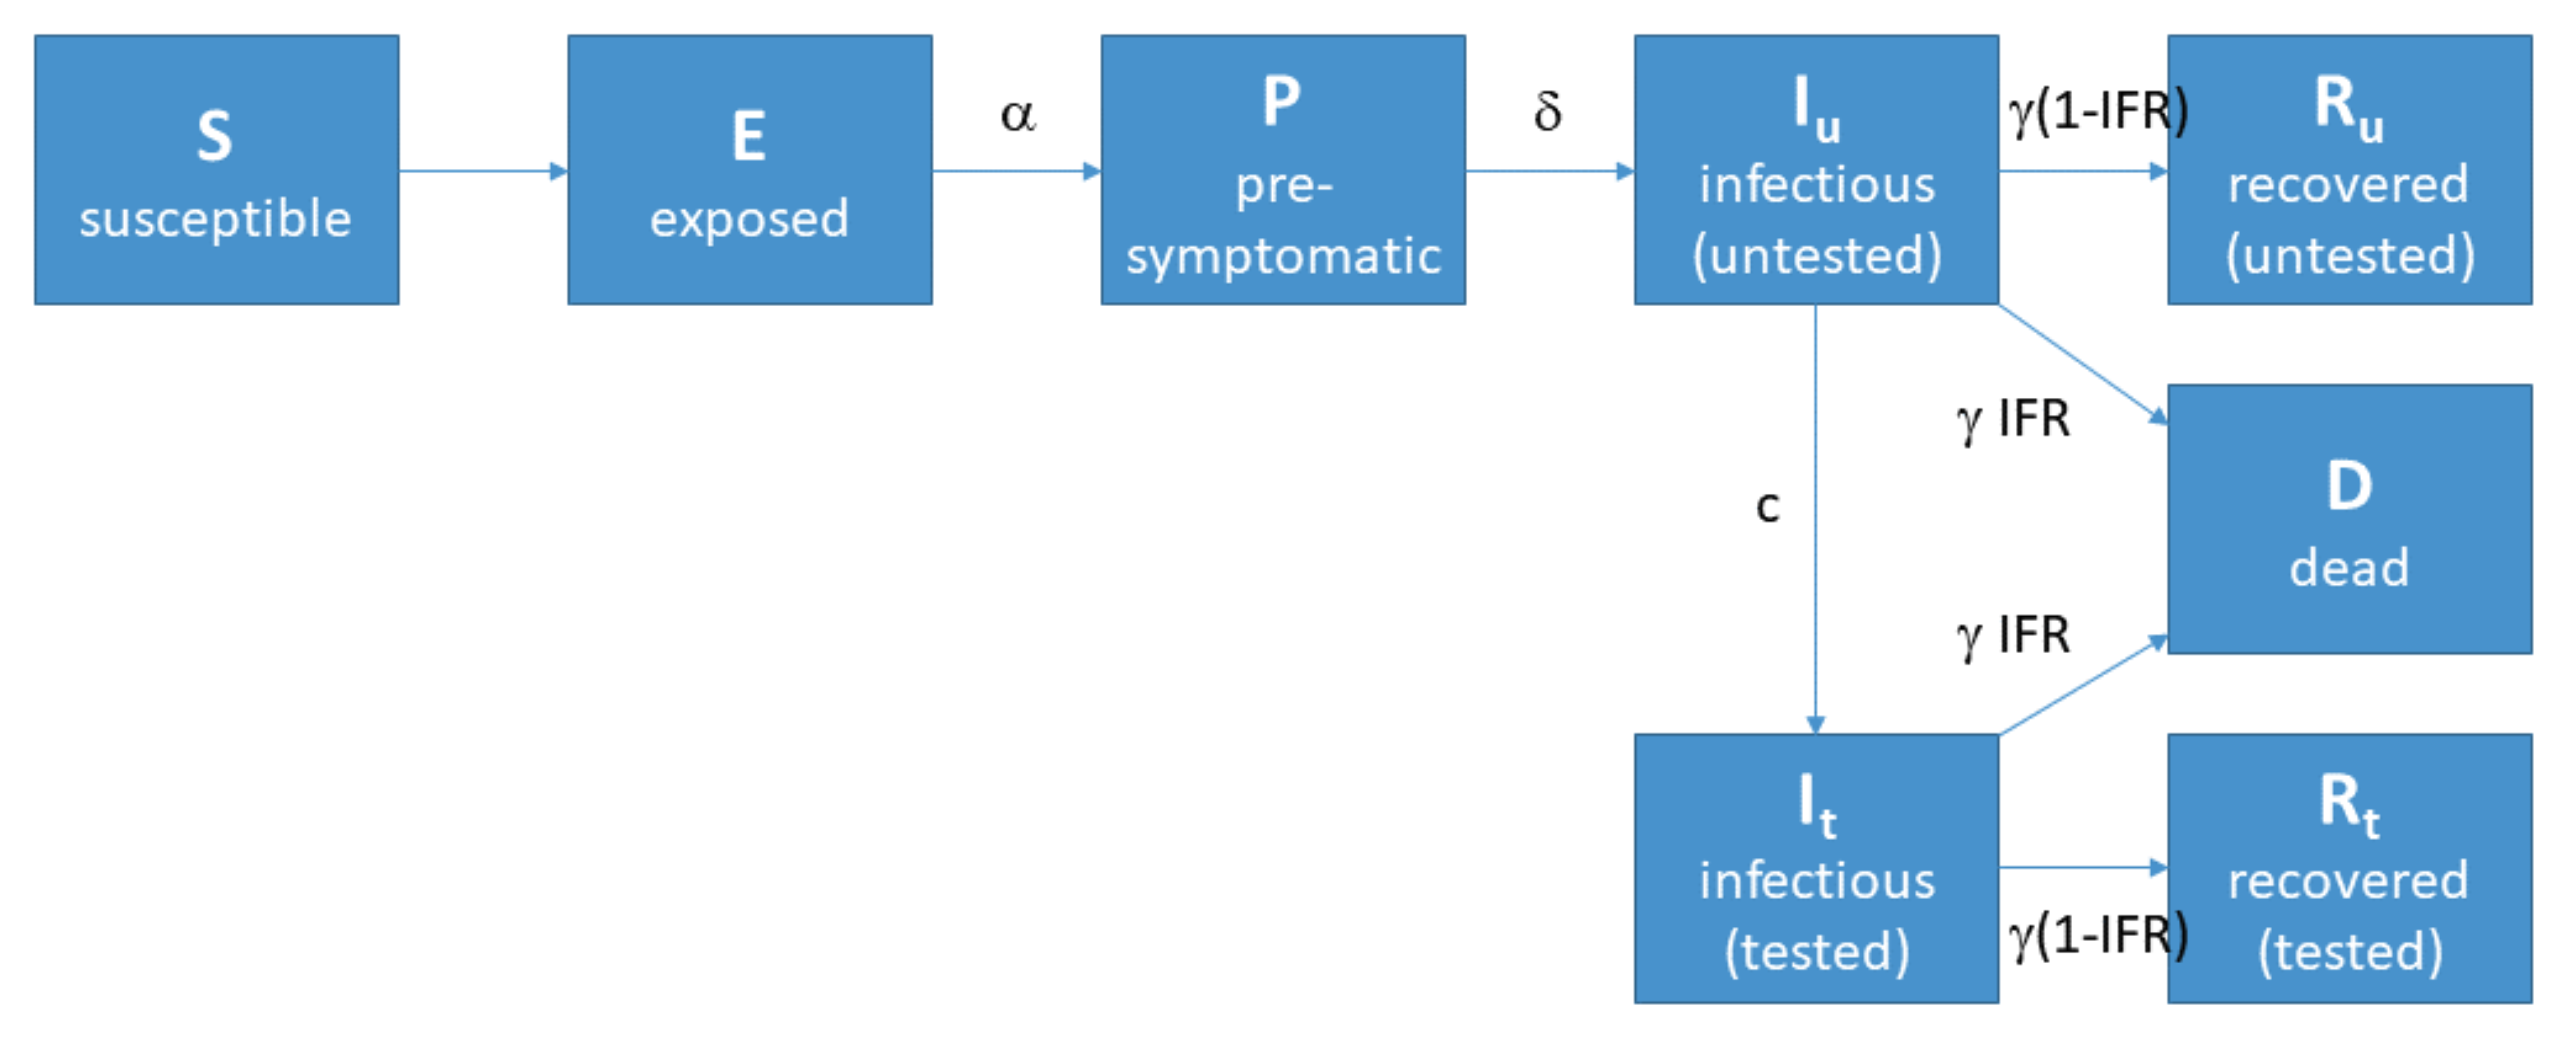
Response informed by simple models

This one was well publicised:
Epidemiology \(\neq\) geography

Implicitly it is

In practice, it is not

Populations understood as aggregate

Not distributed and variegated

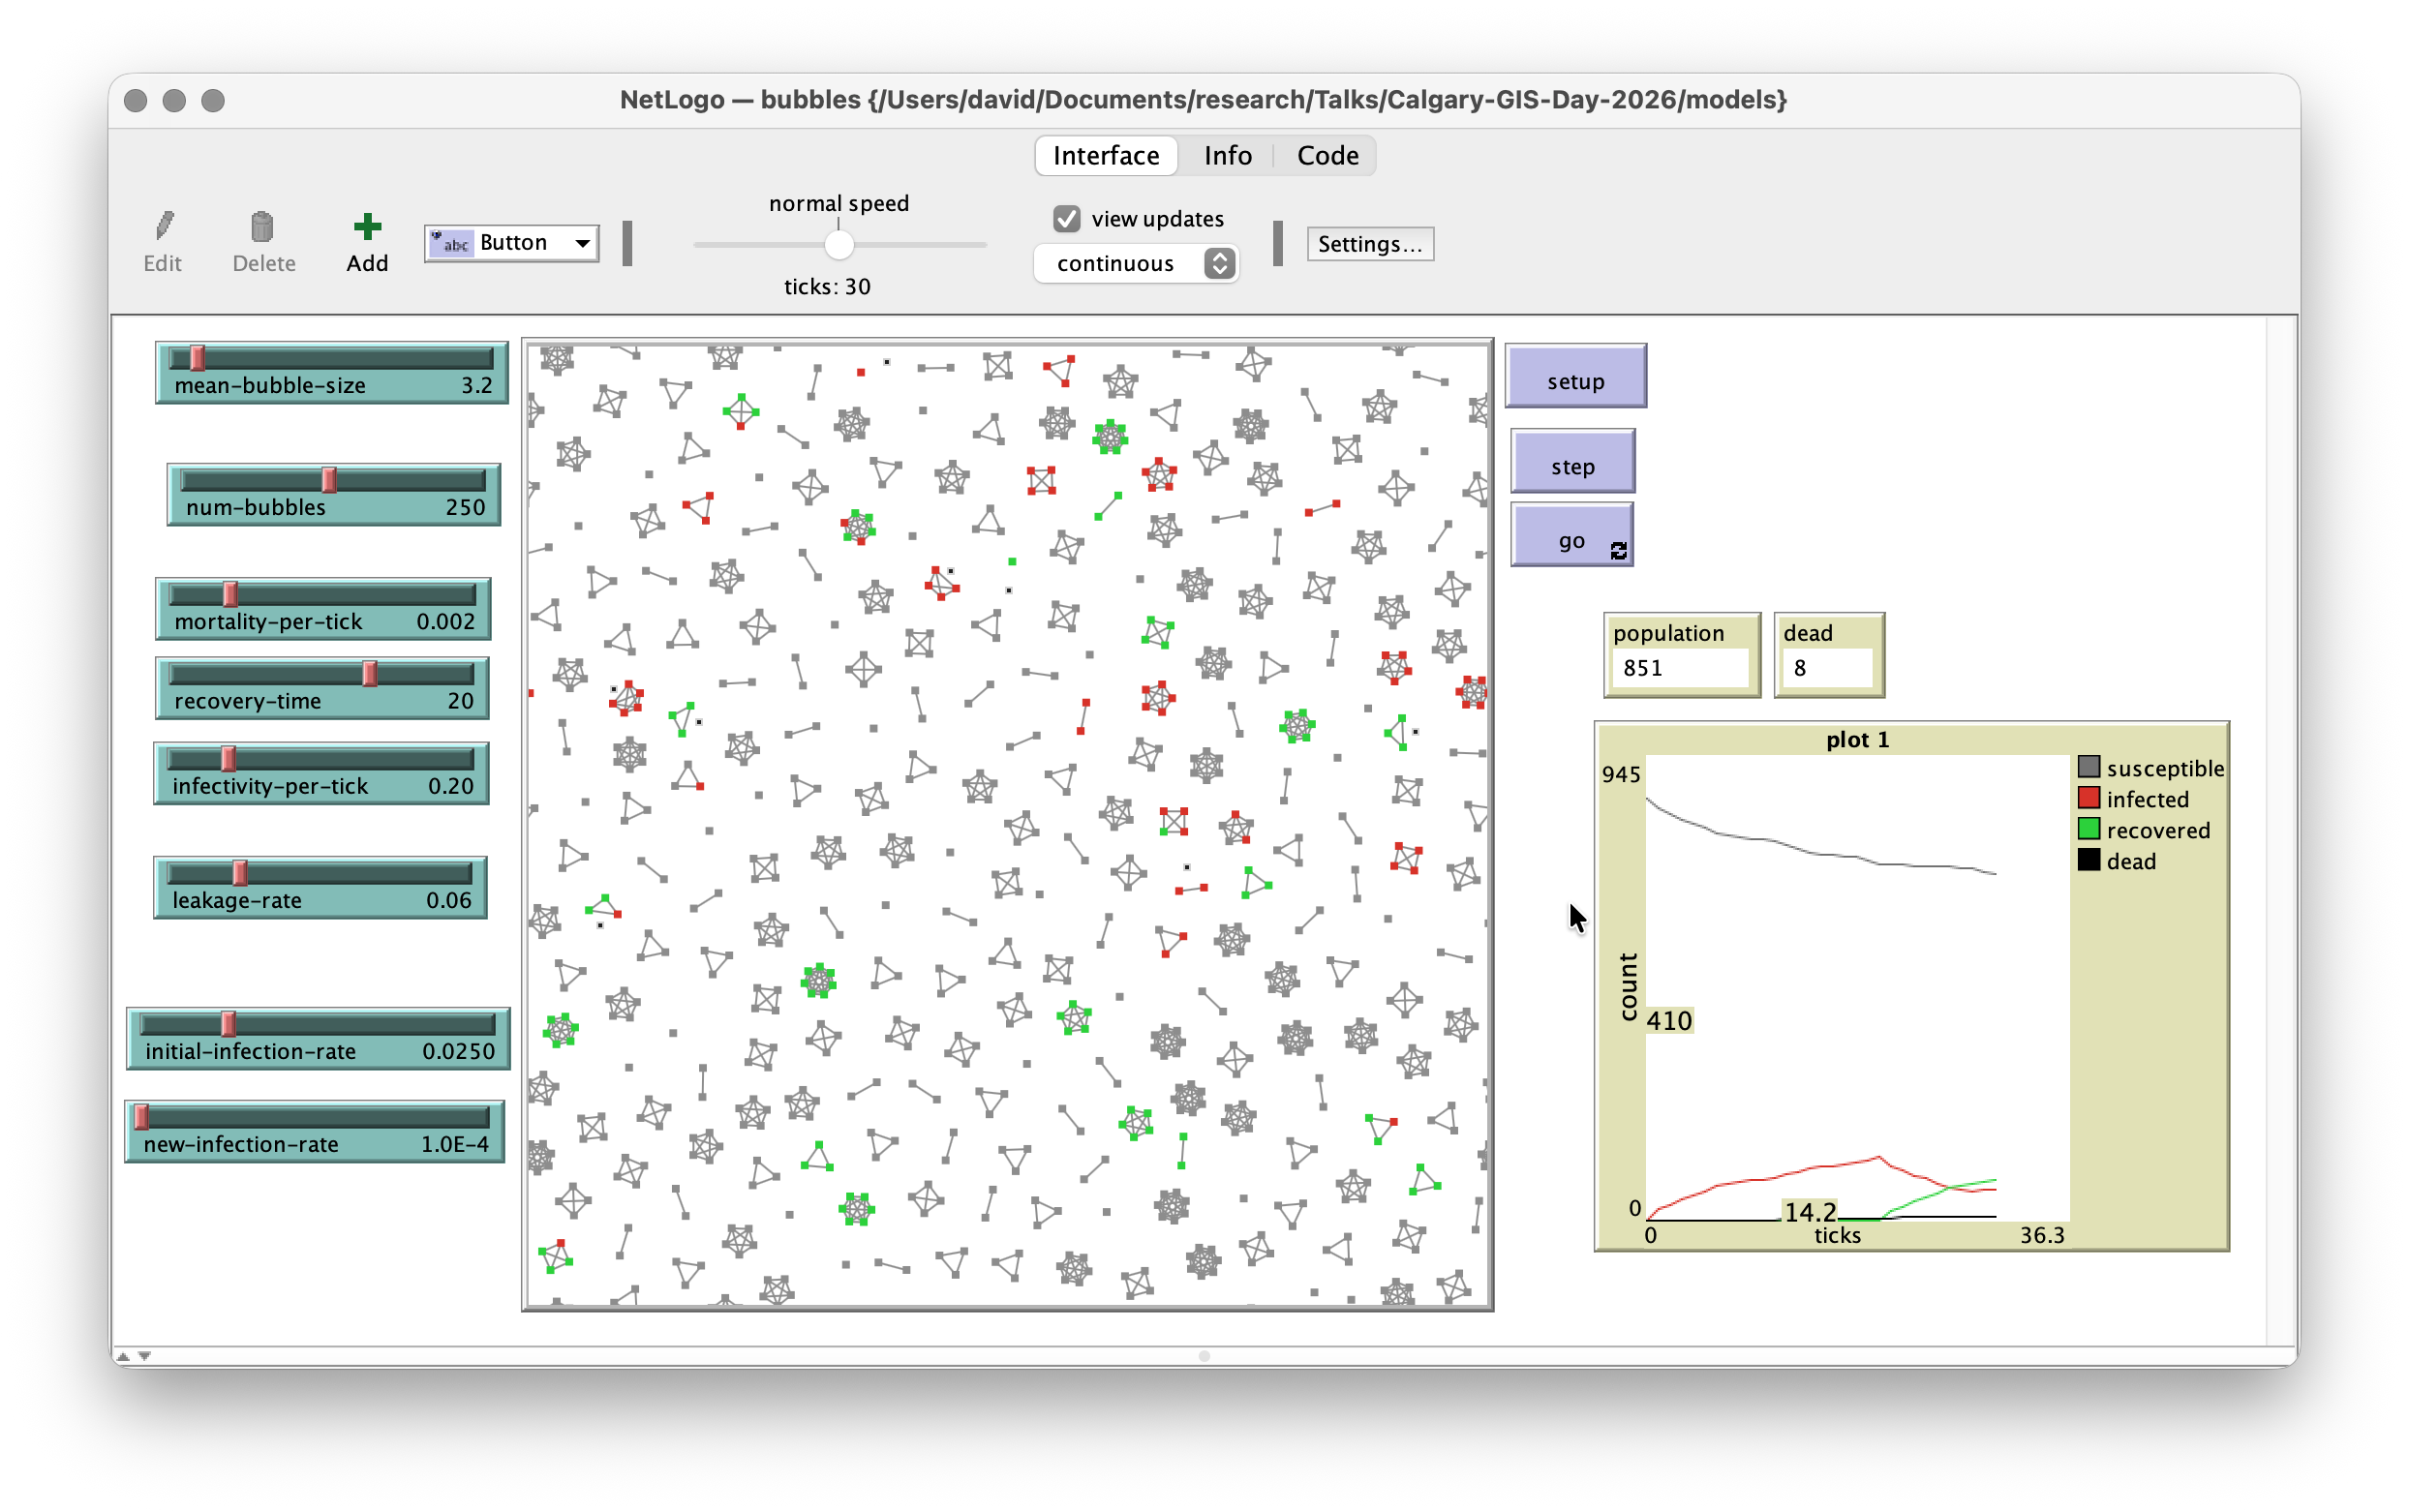
Exploring bubbles

Bubbles nested in suburbs
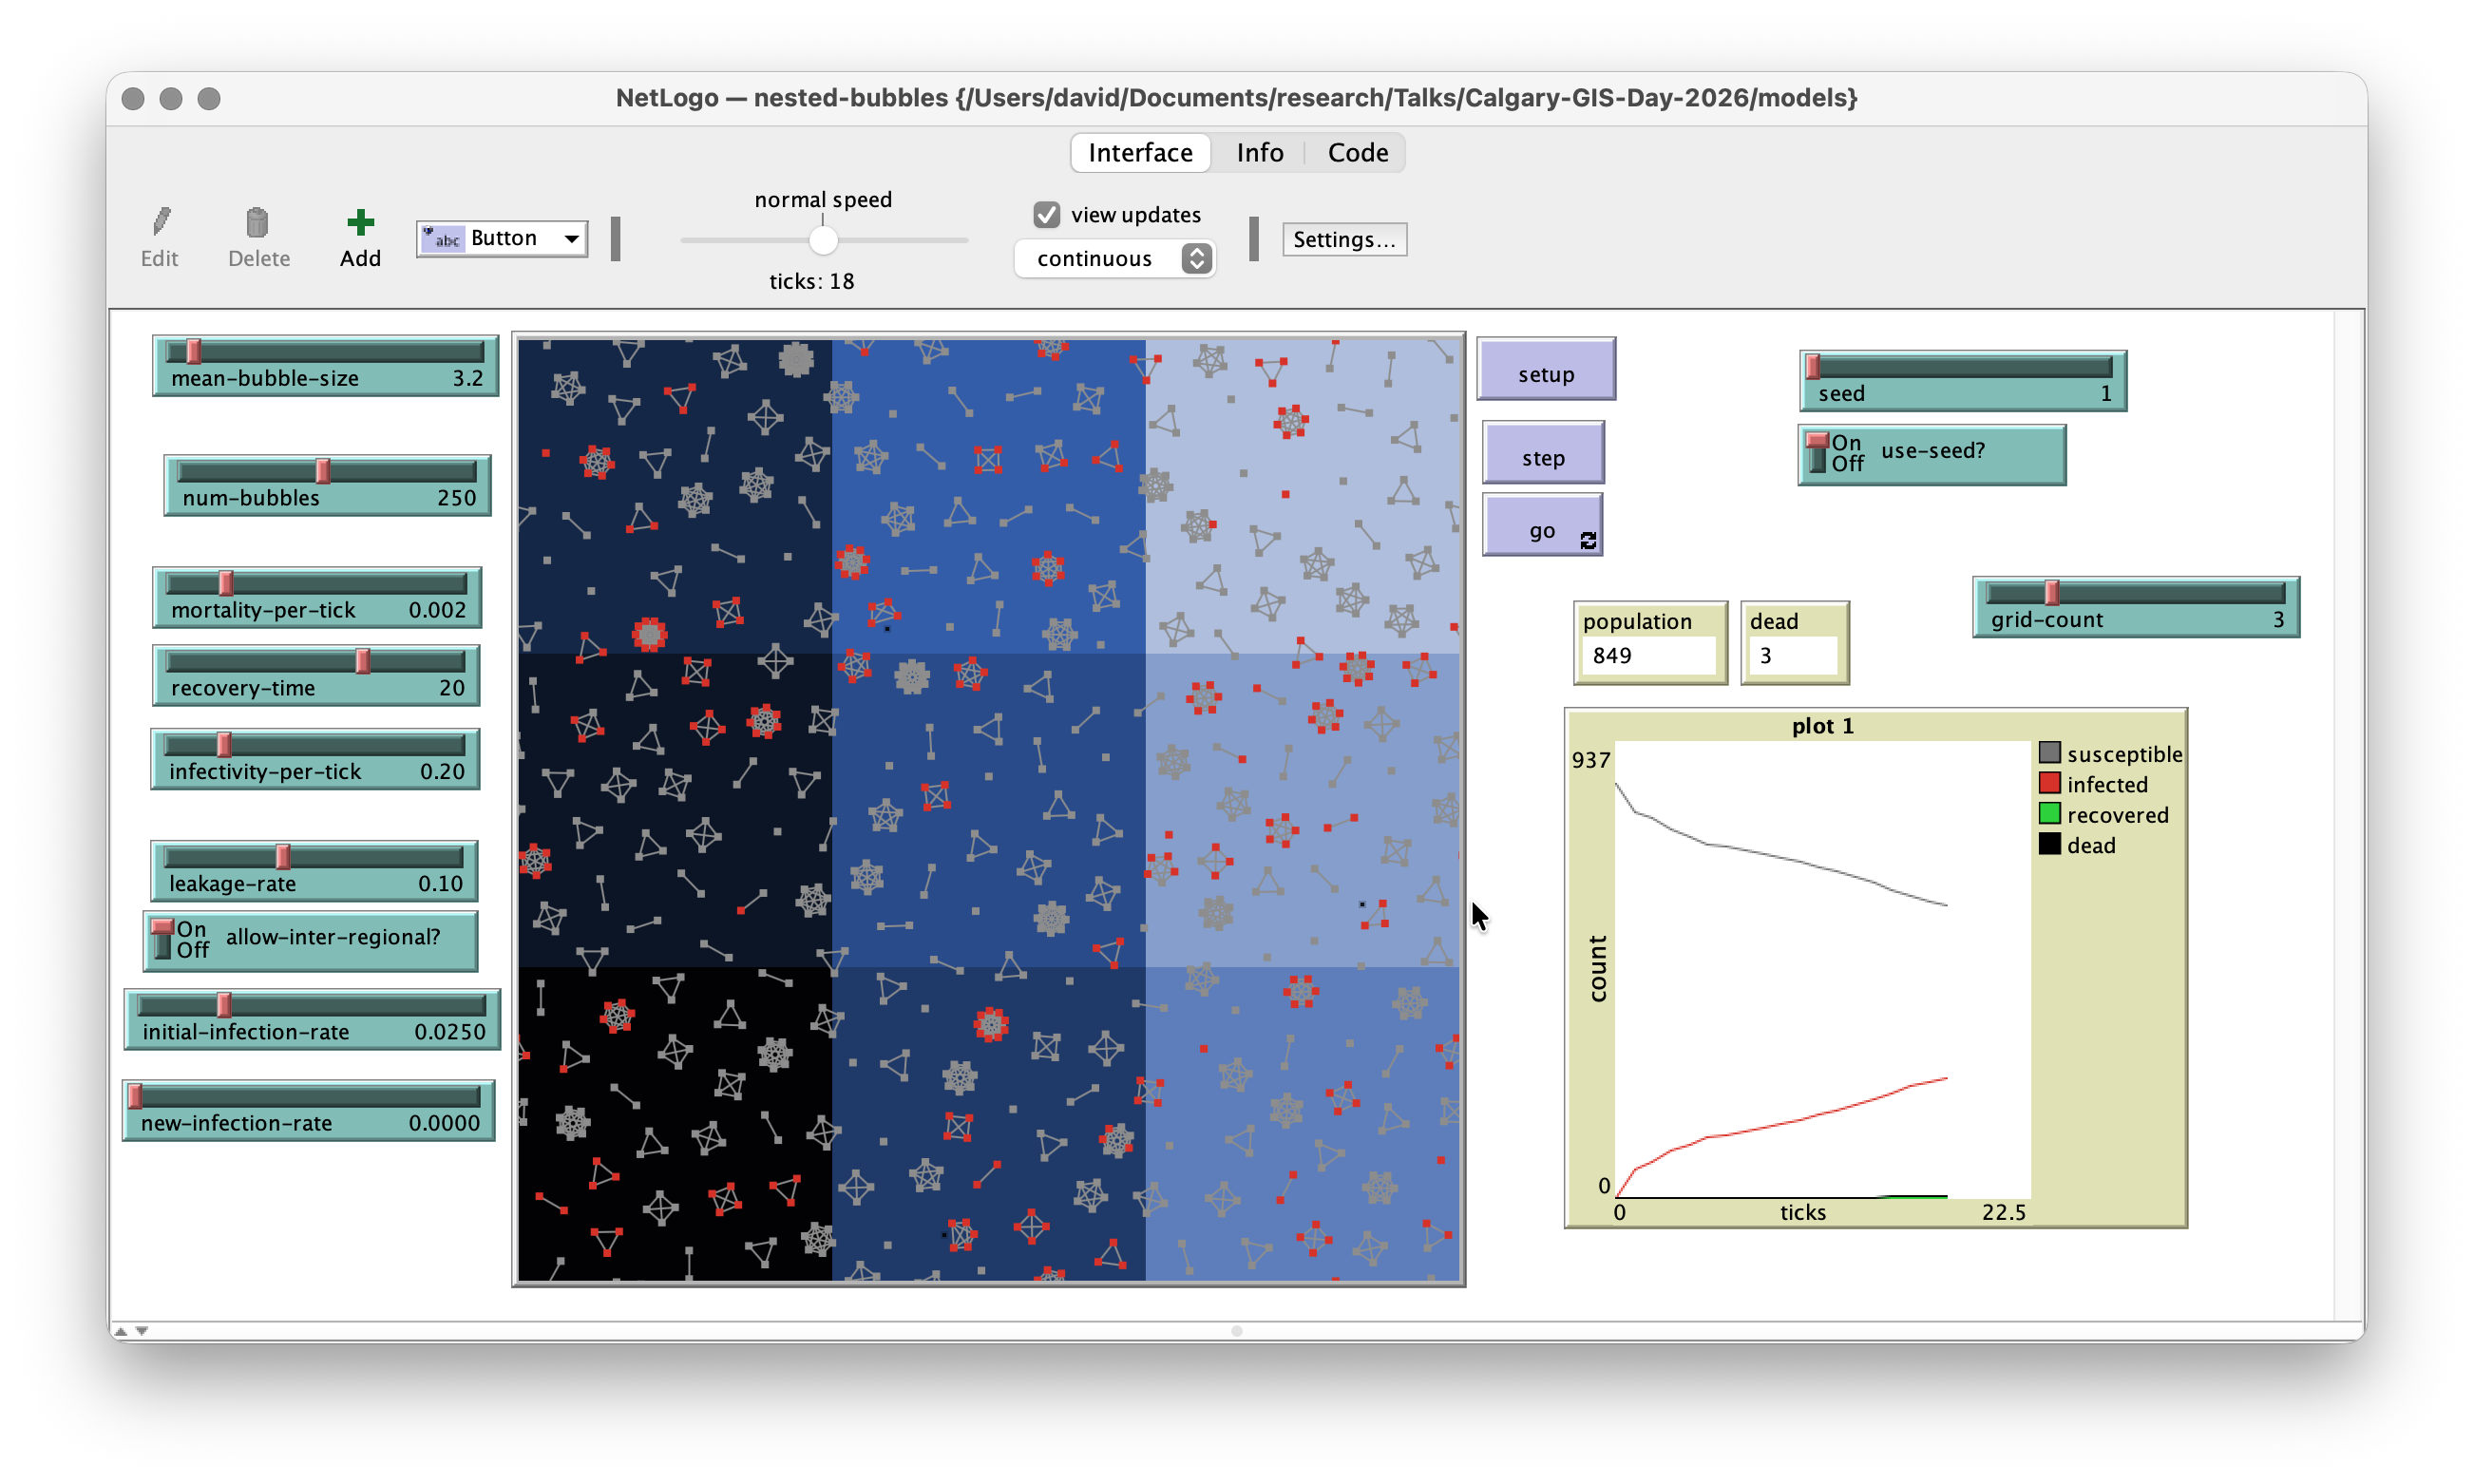
Regionalising SEIR
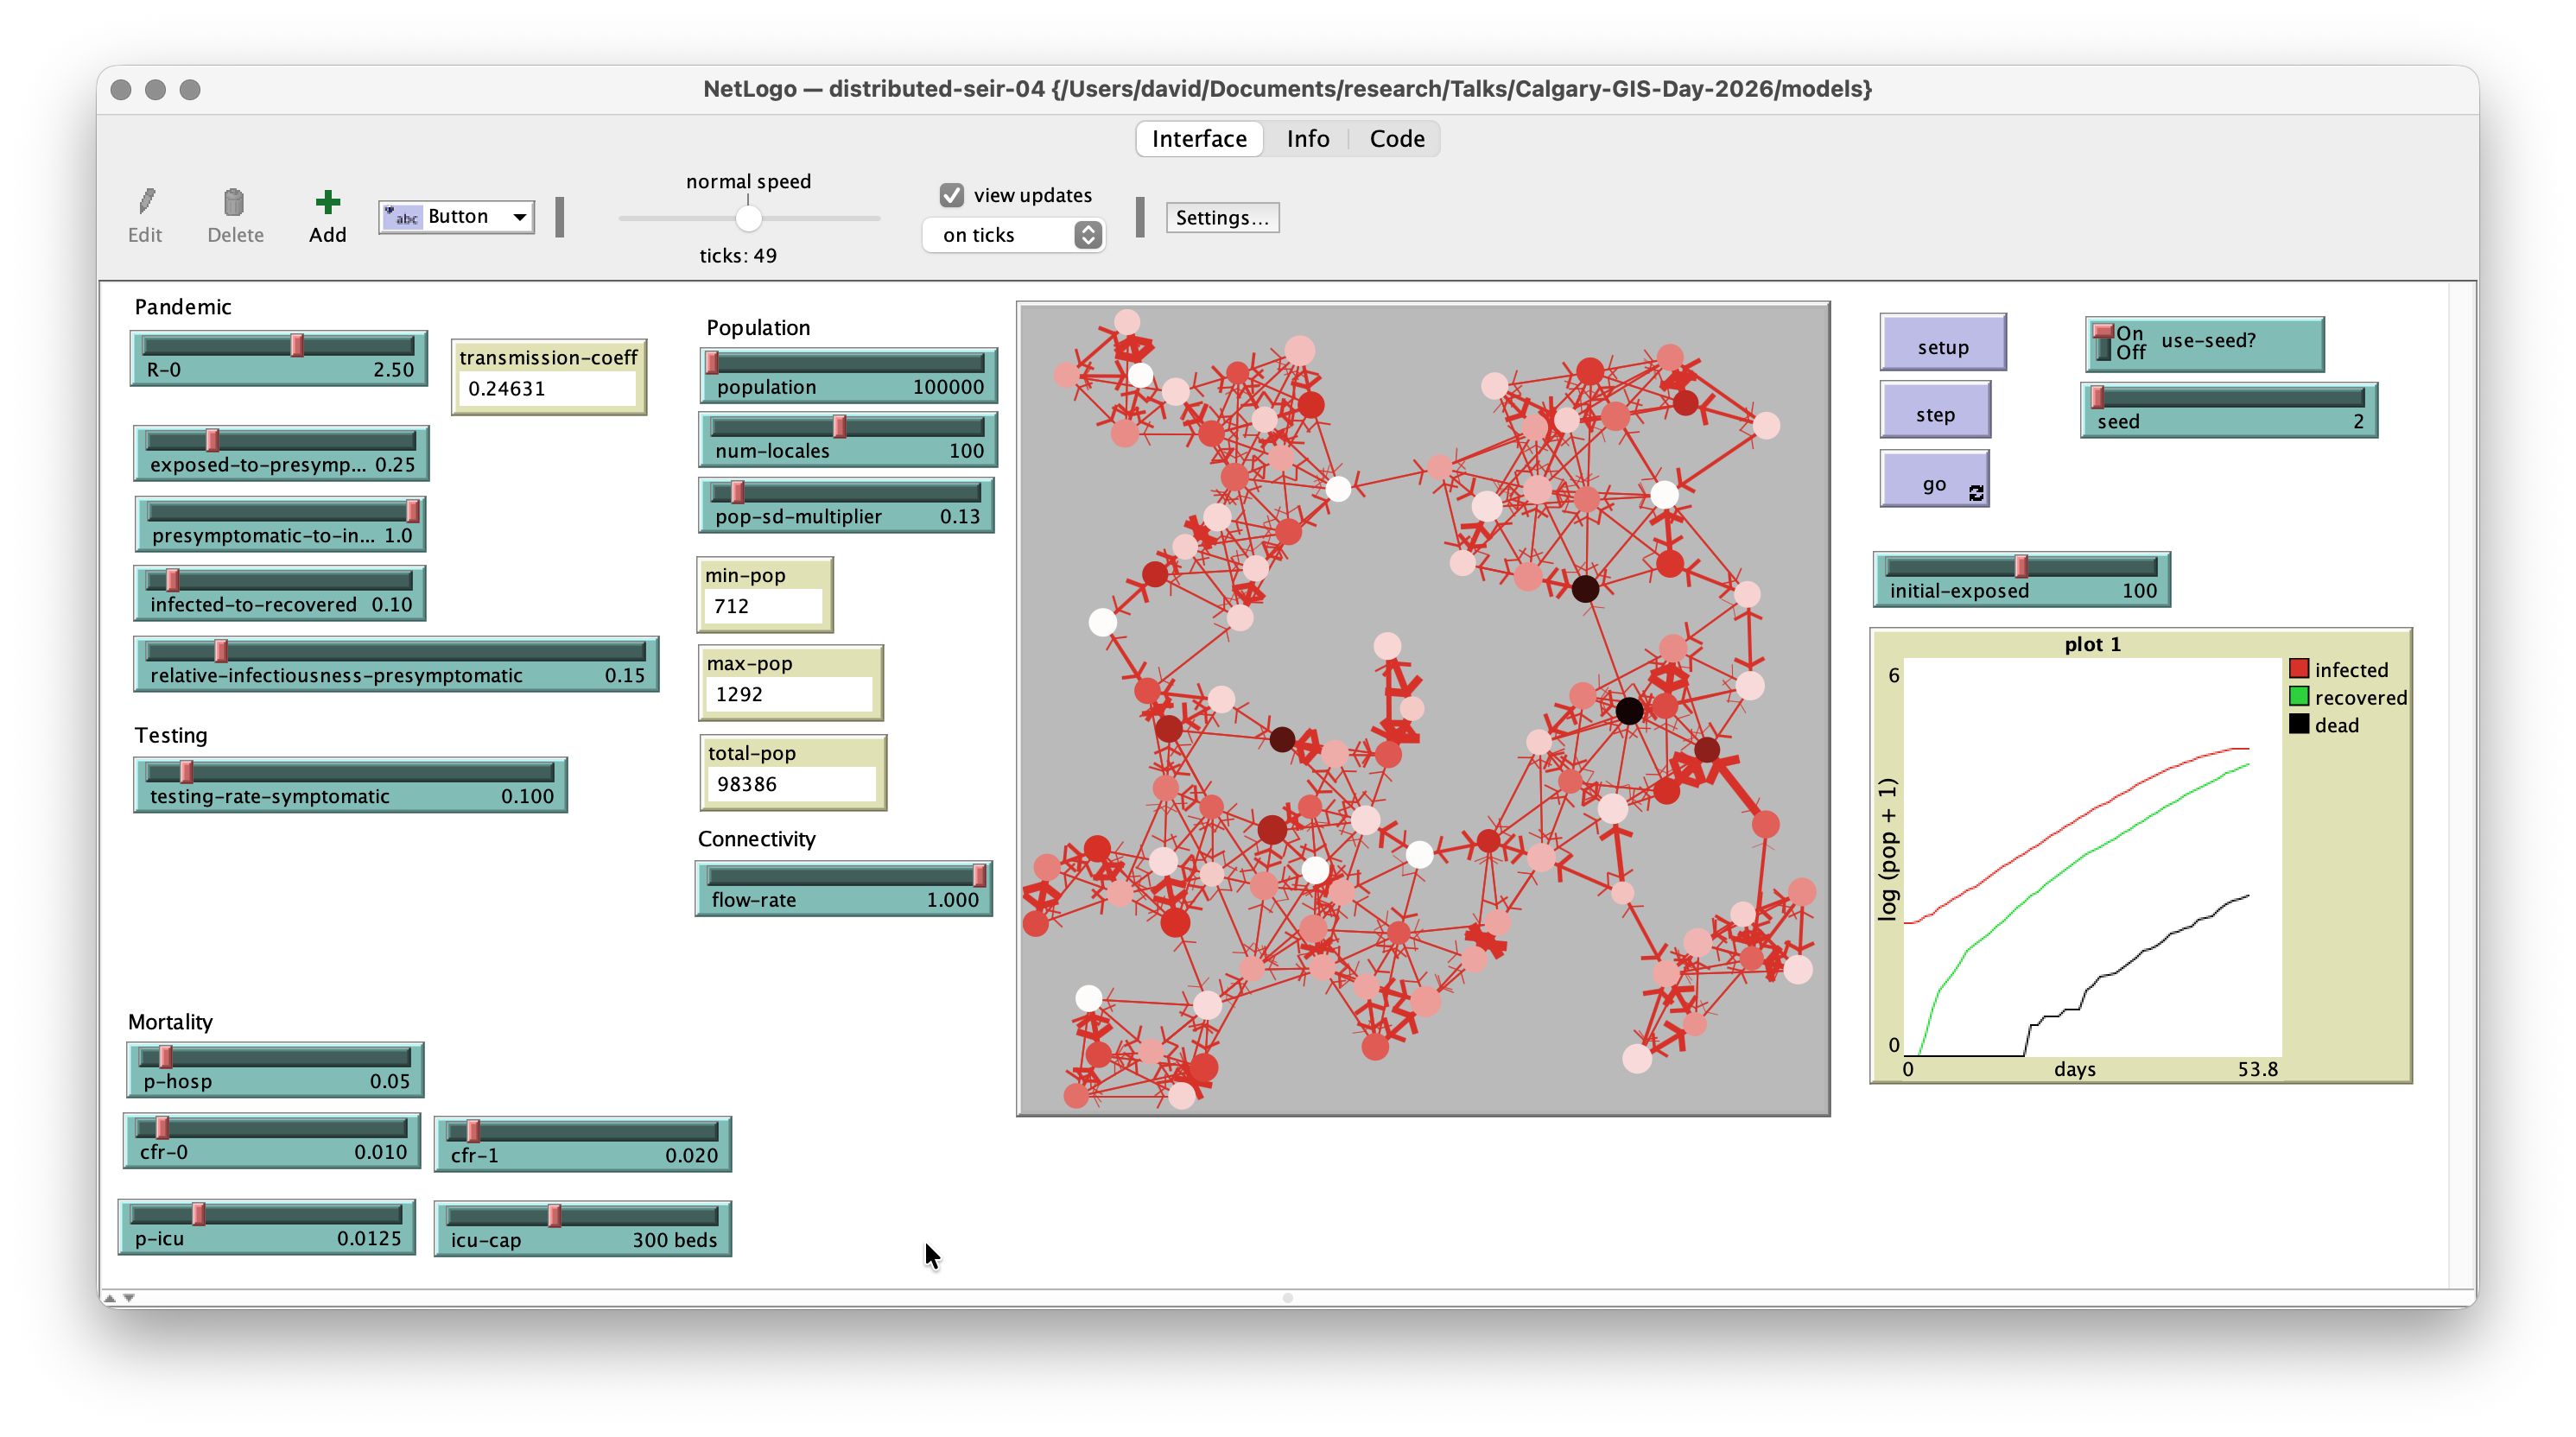
SEIR with local lockdowns
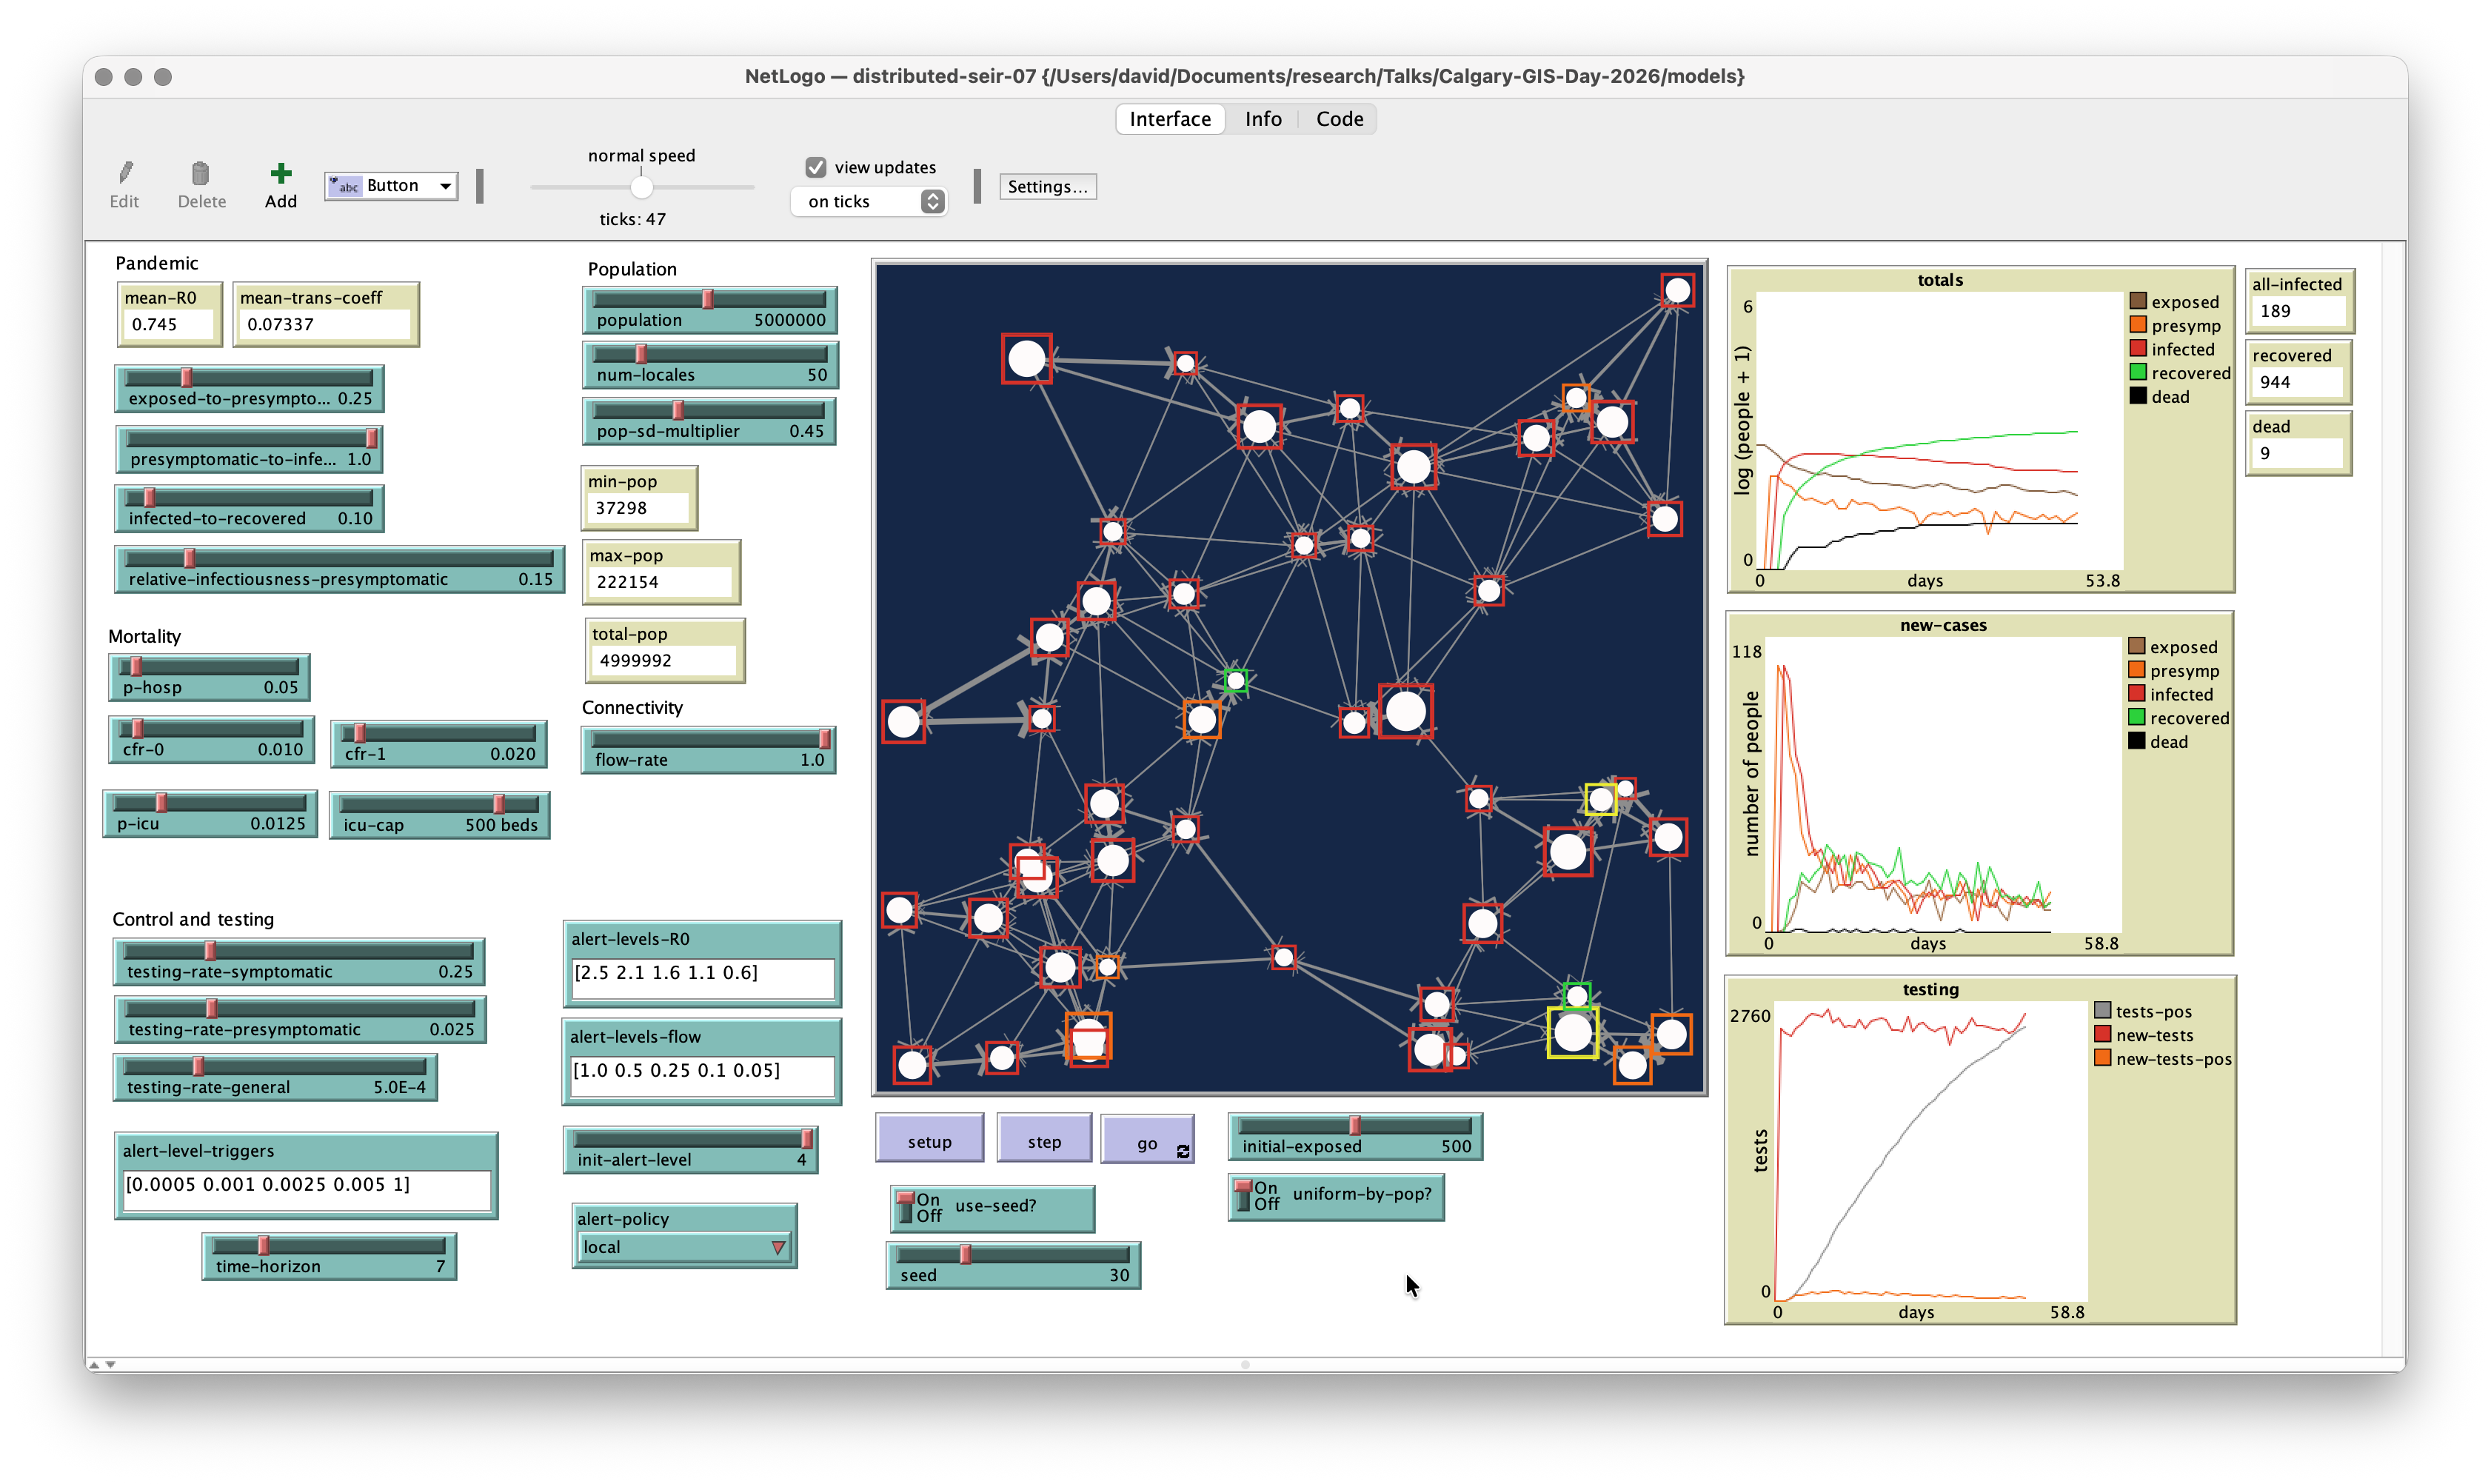
A spatialised branching process
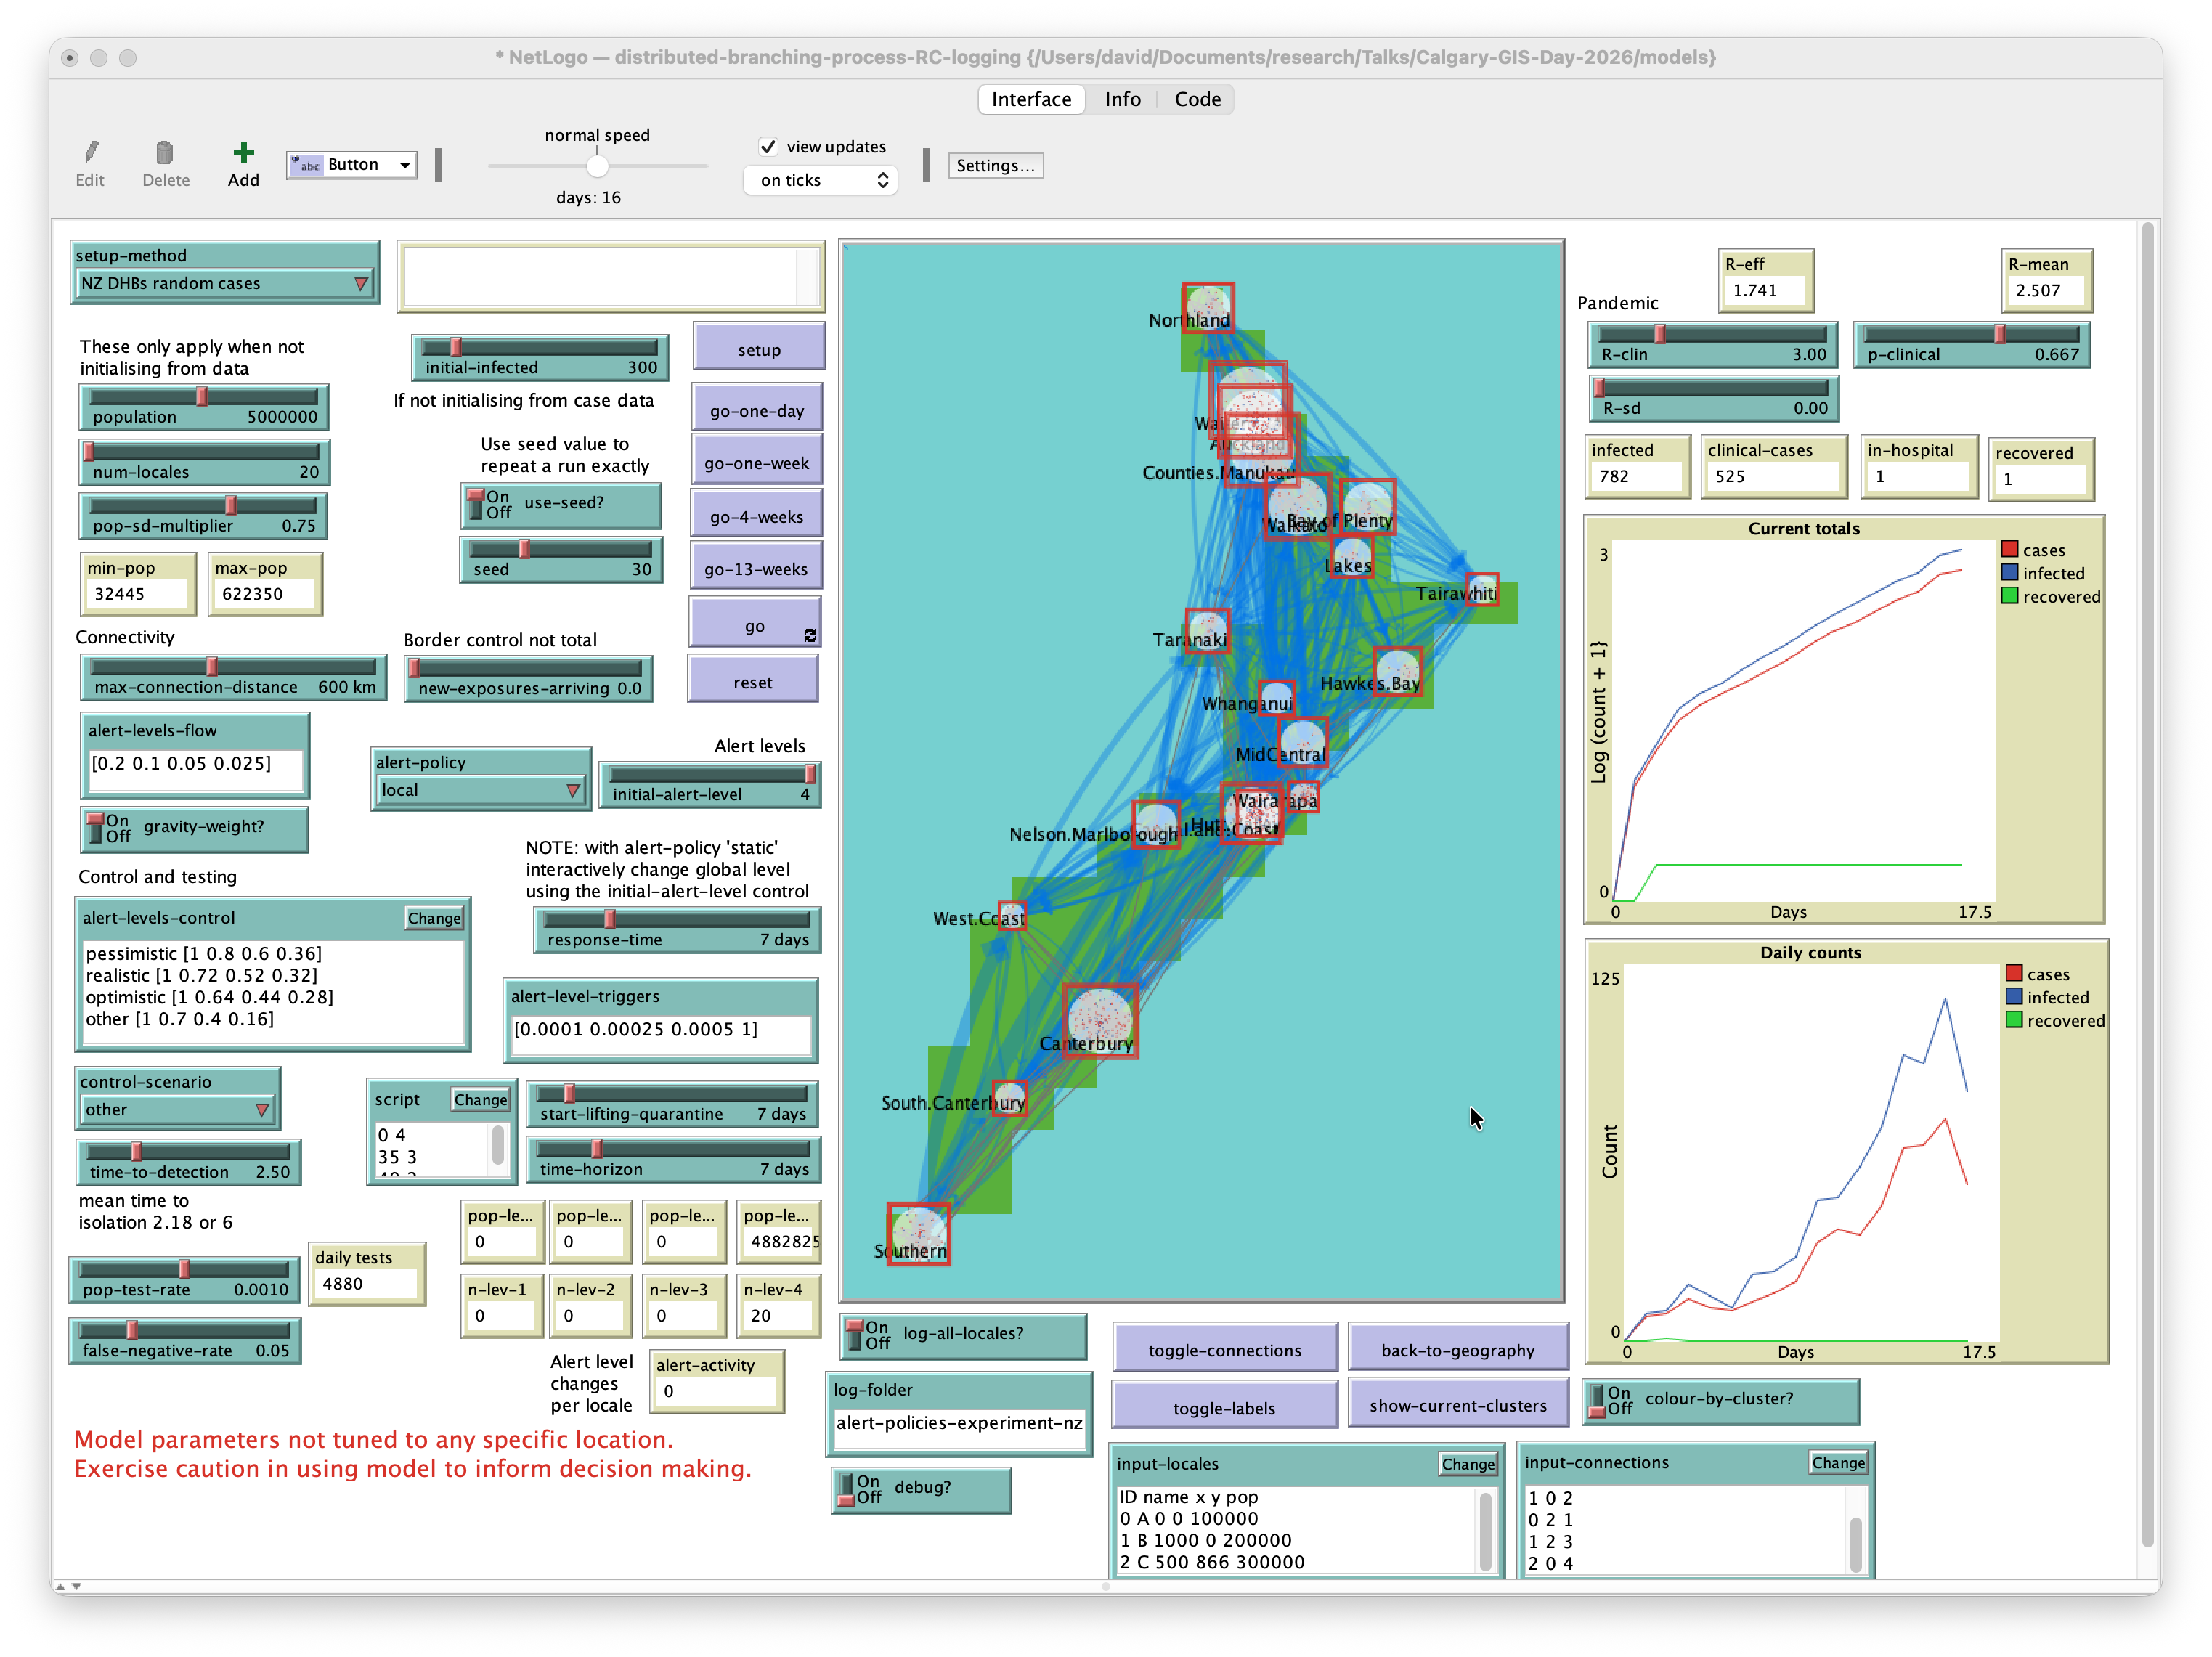
Branching process model
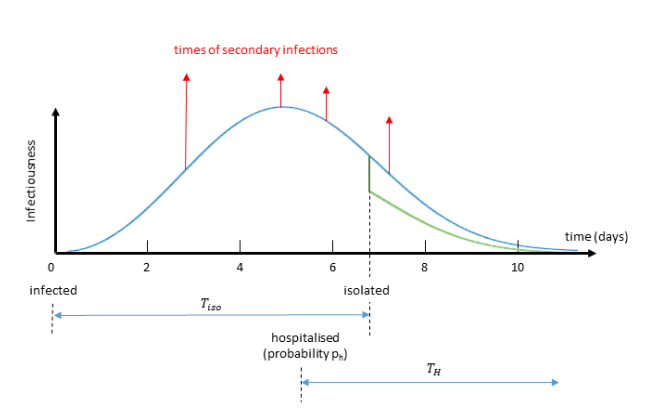
Plank MJ at al. 2020. A stochastic model for COVID-19 spread and the effects of Alert Level 4 in Aotearoa New Zealand. Preprint on medrxiv.org. doi: 10.1101/2020.04.08.20058743.

Each infection has a time-varying probability of causing future infections

New infections may not occur depending on local \(R_0\) at time they are scheduled

May occur non-locally in another connected locale

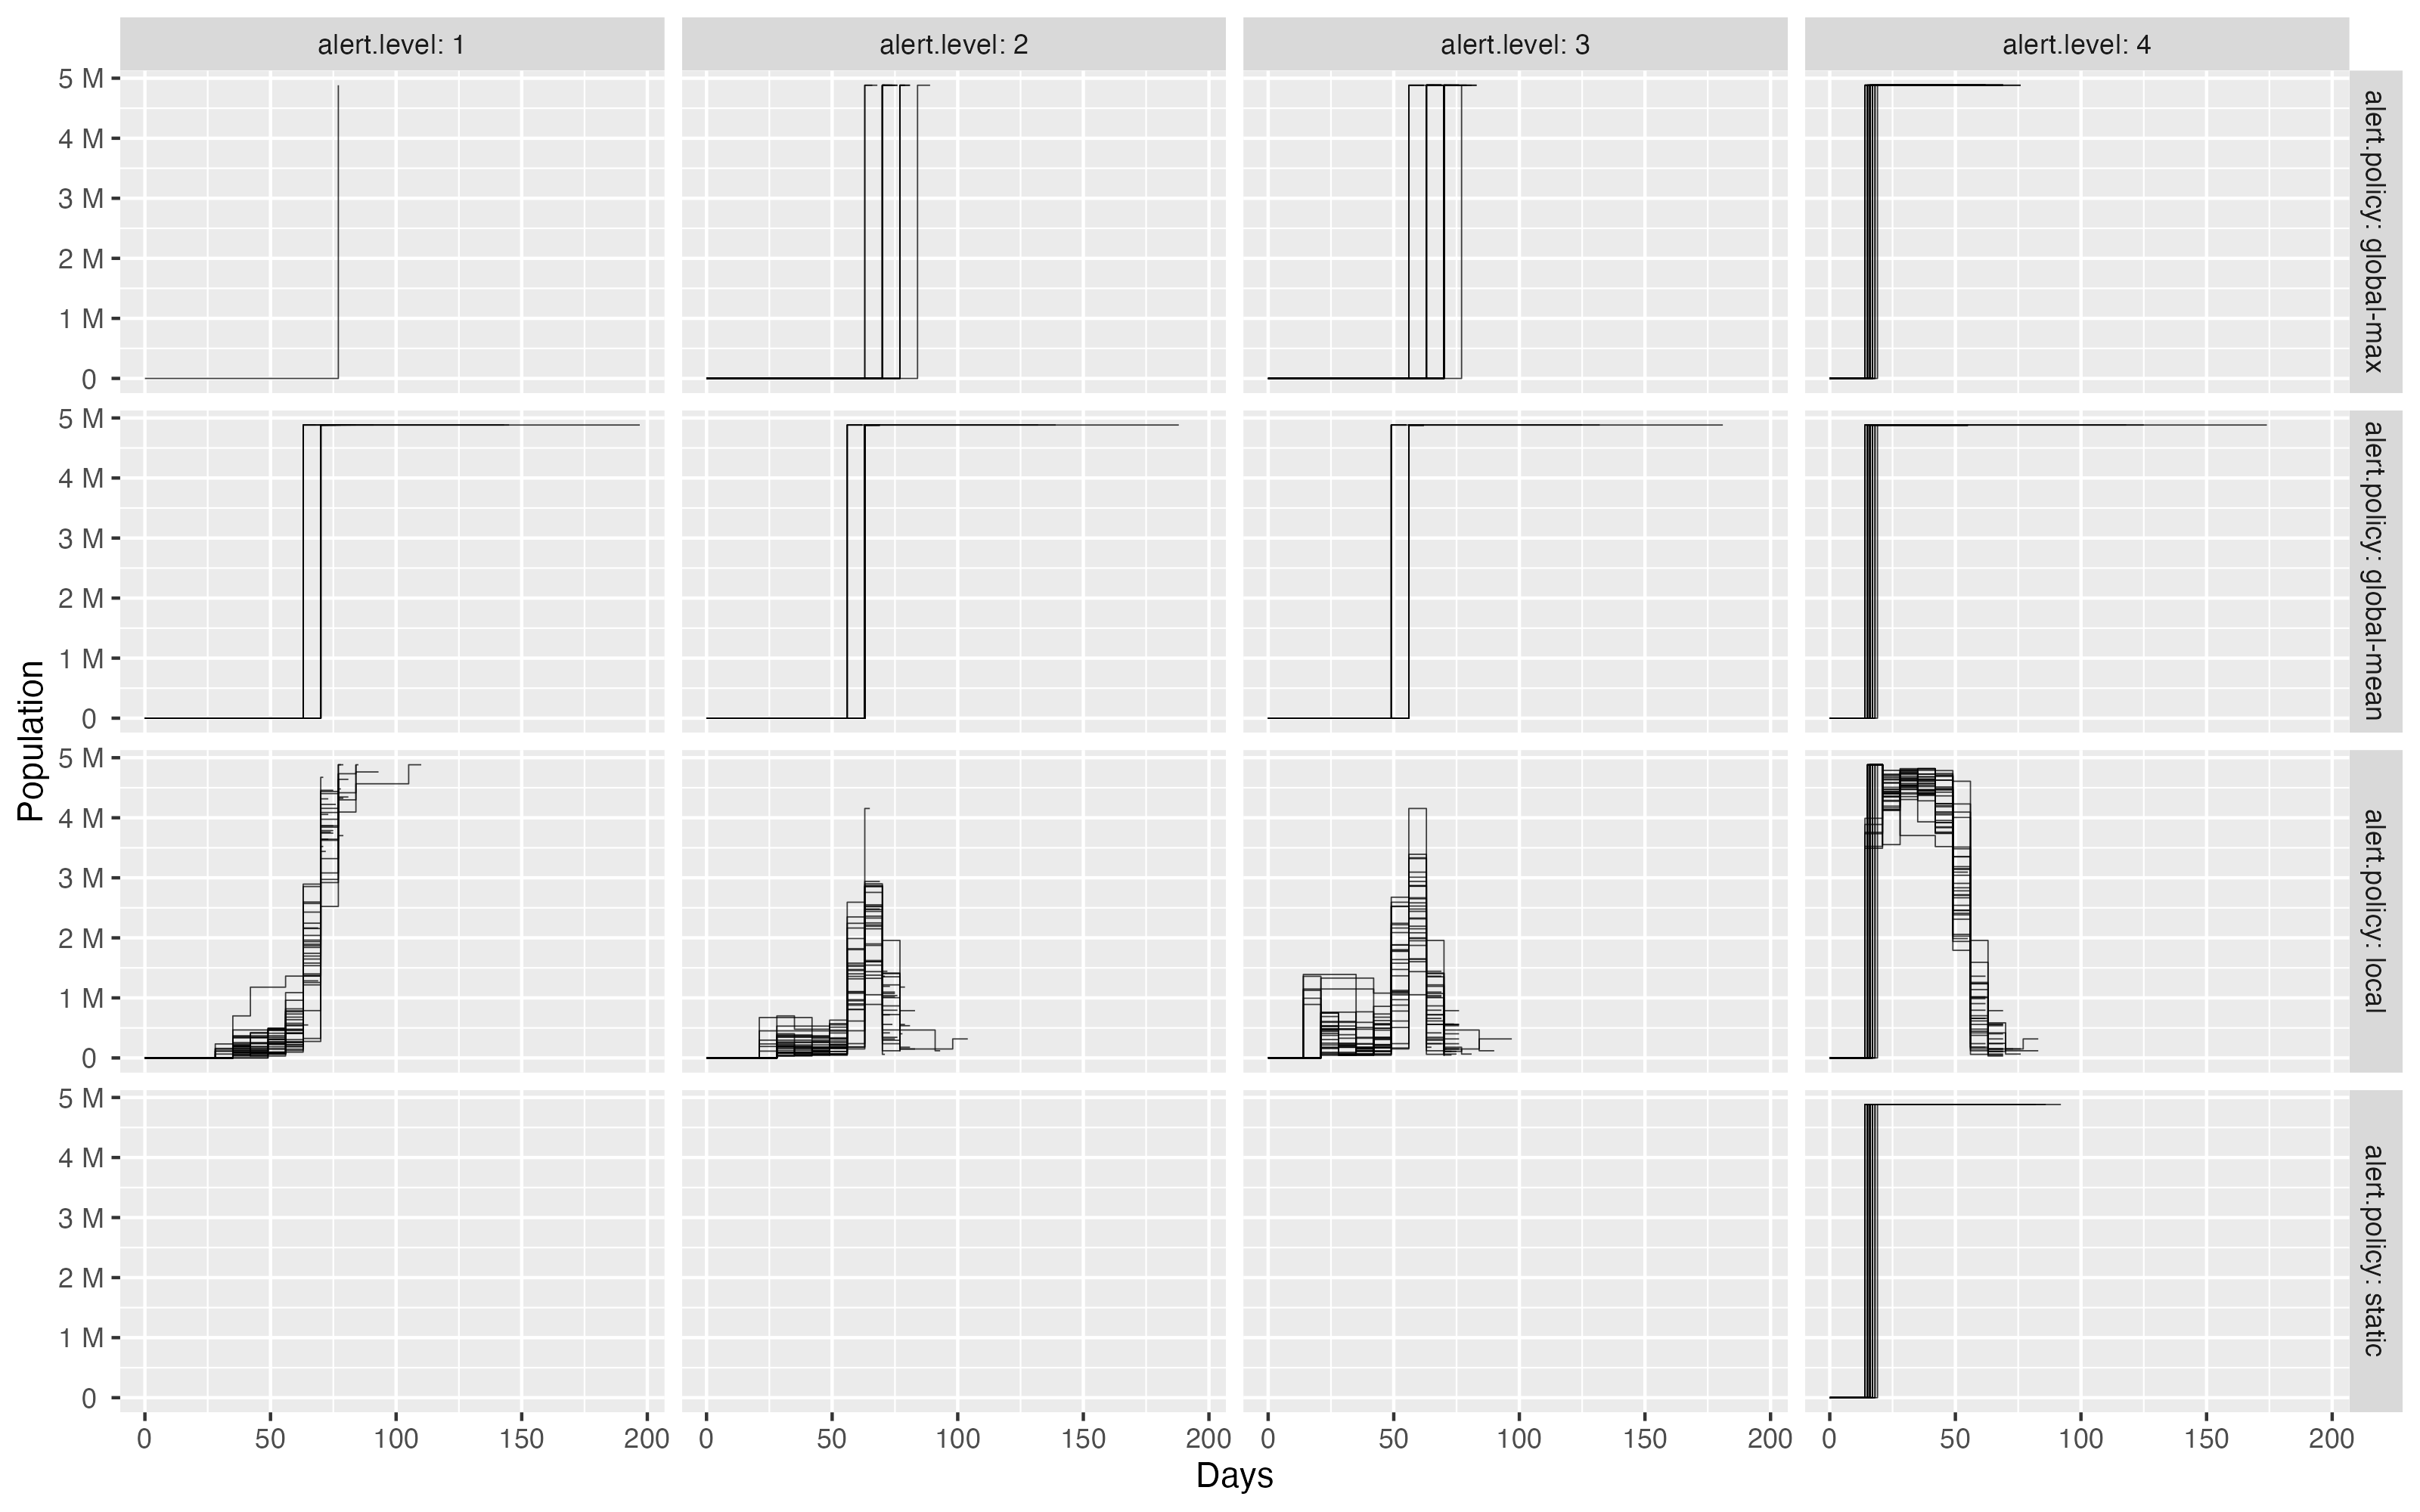
Alert level policy effects
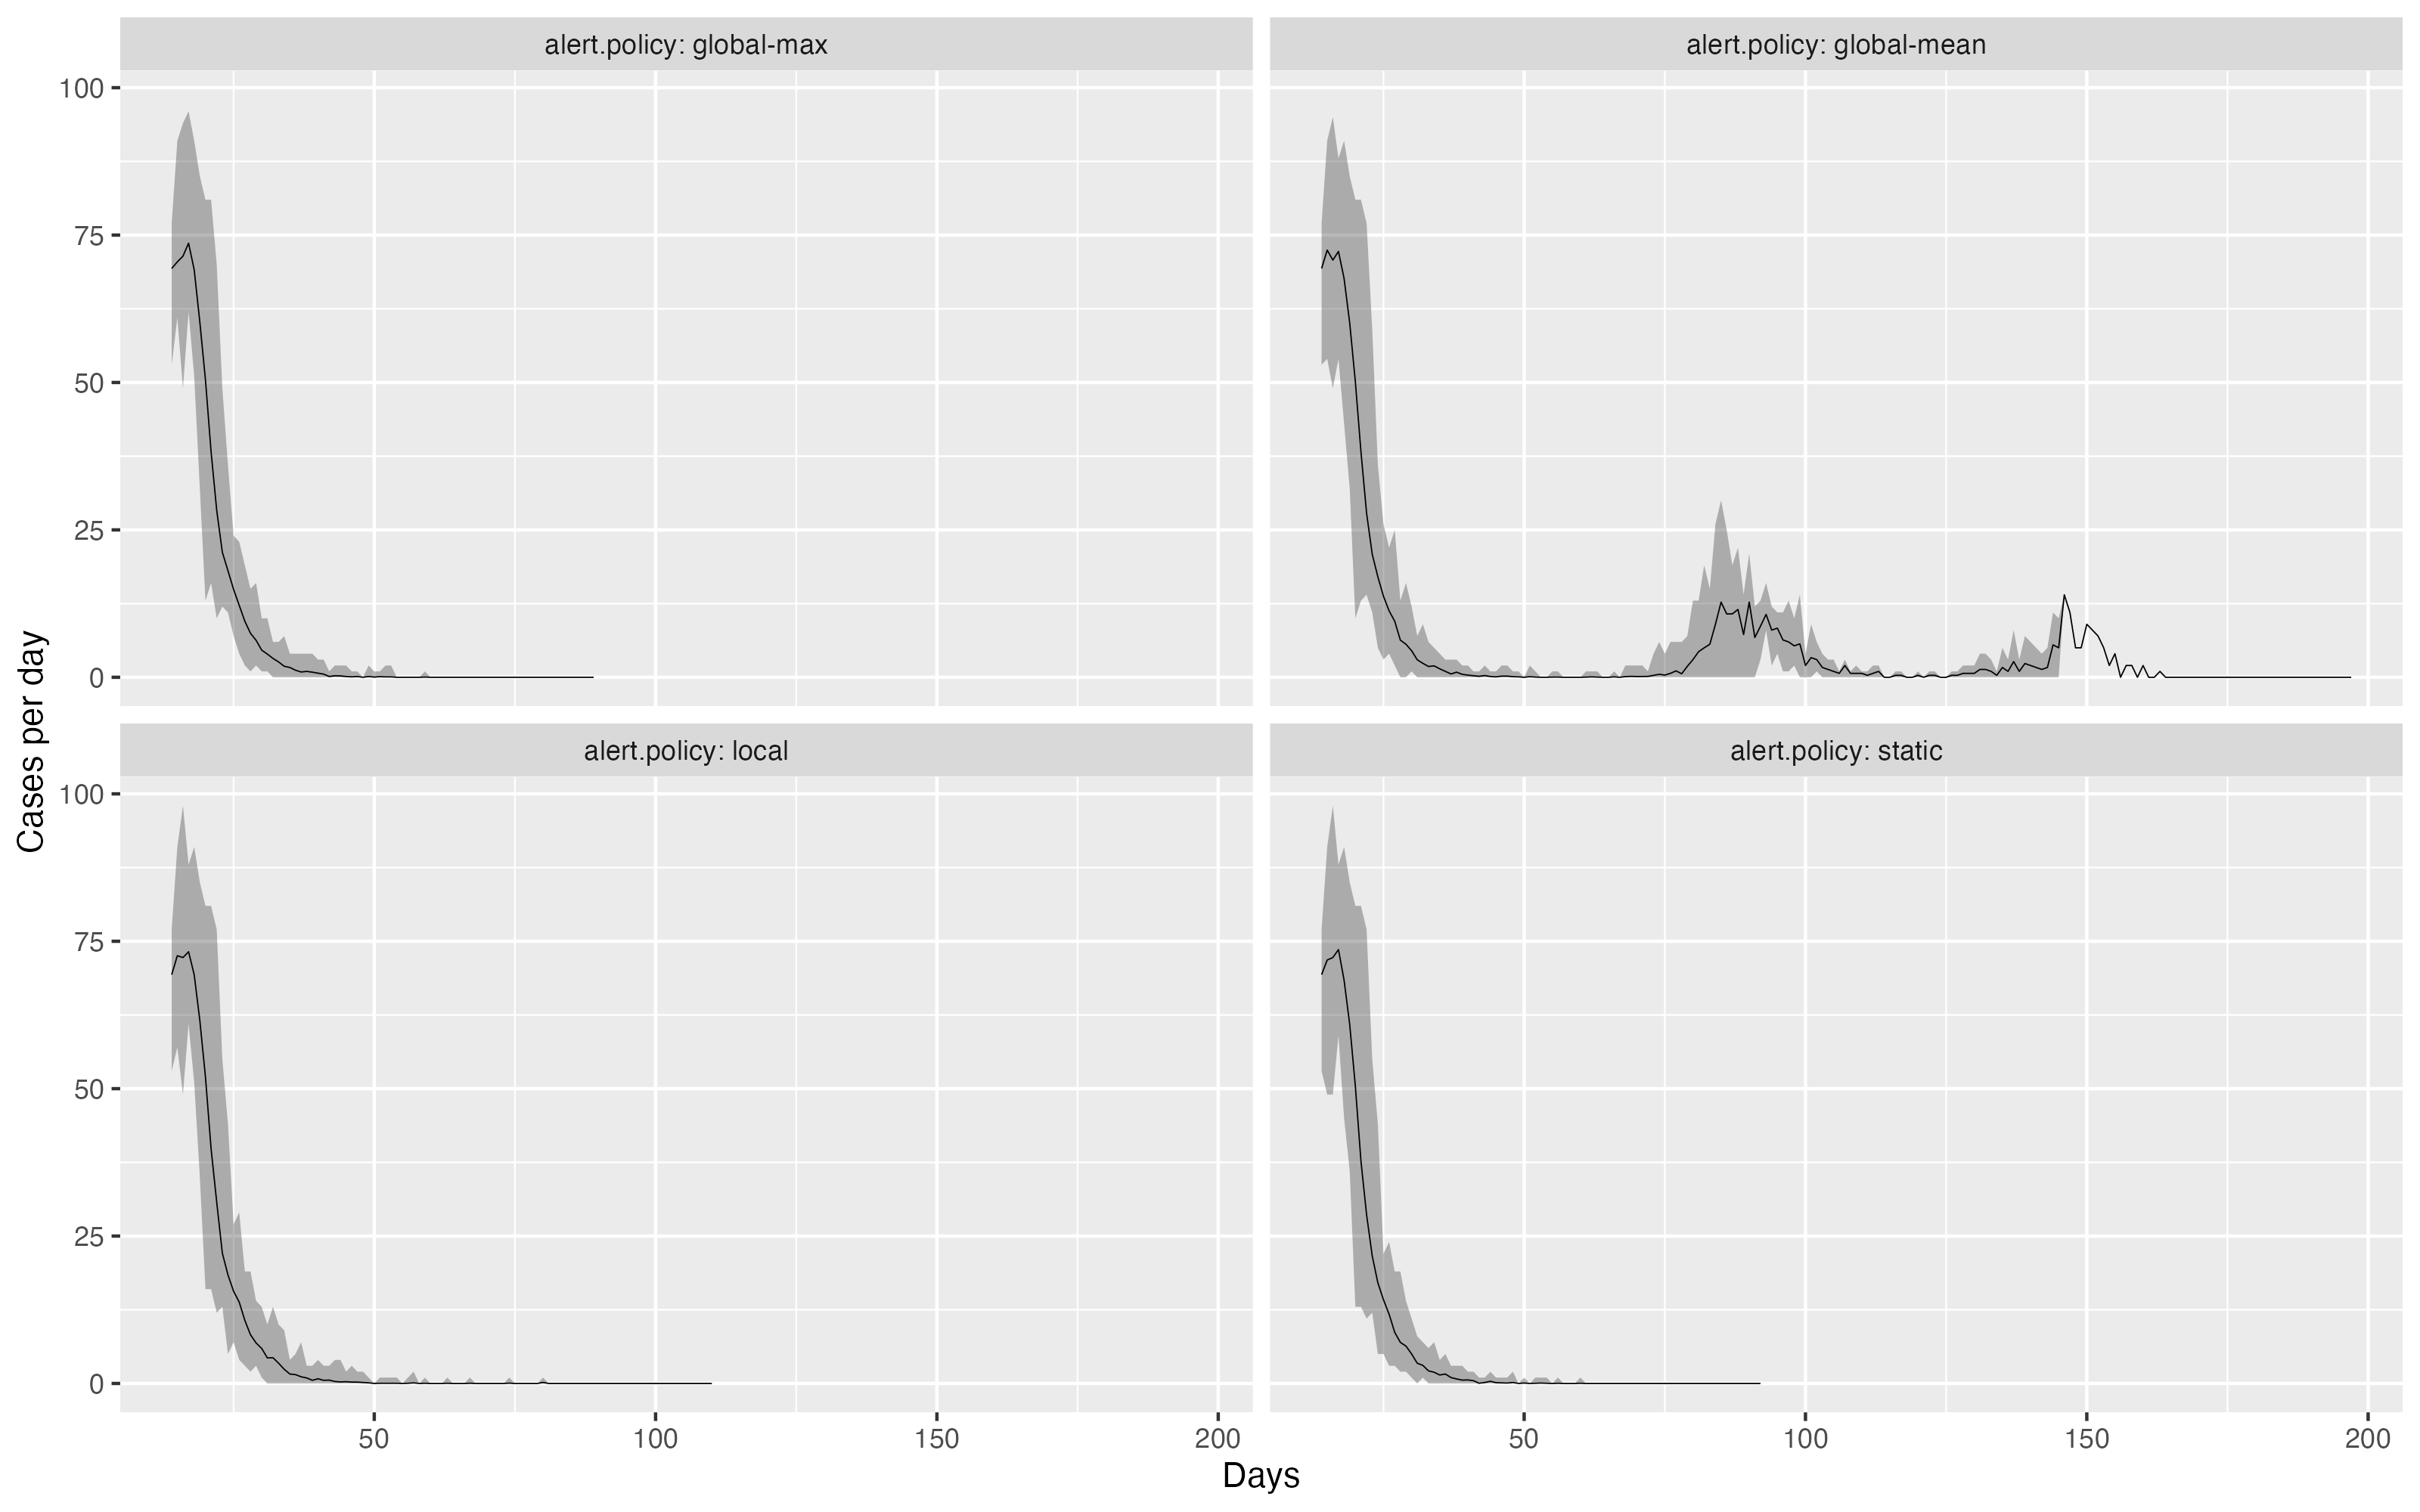
Alert level policy effects
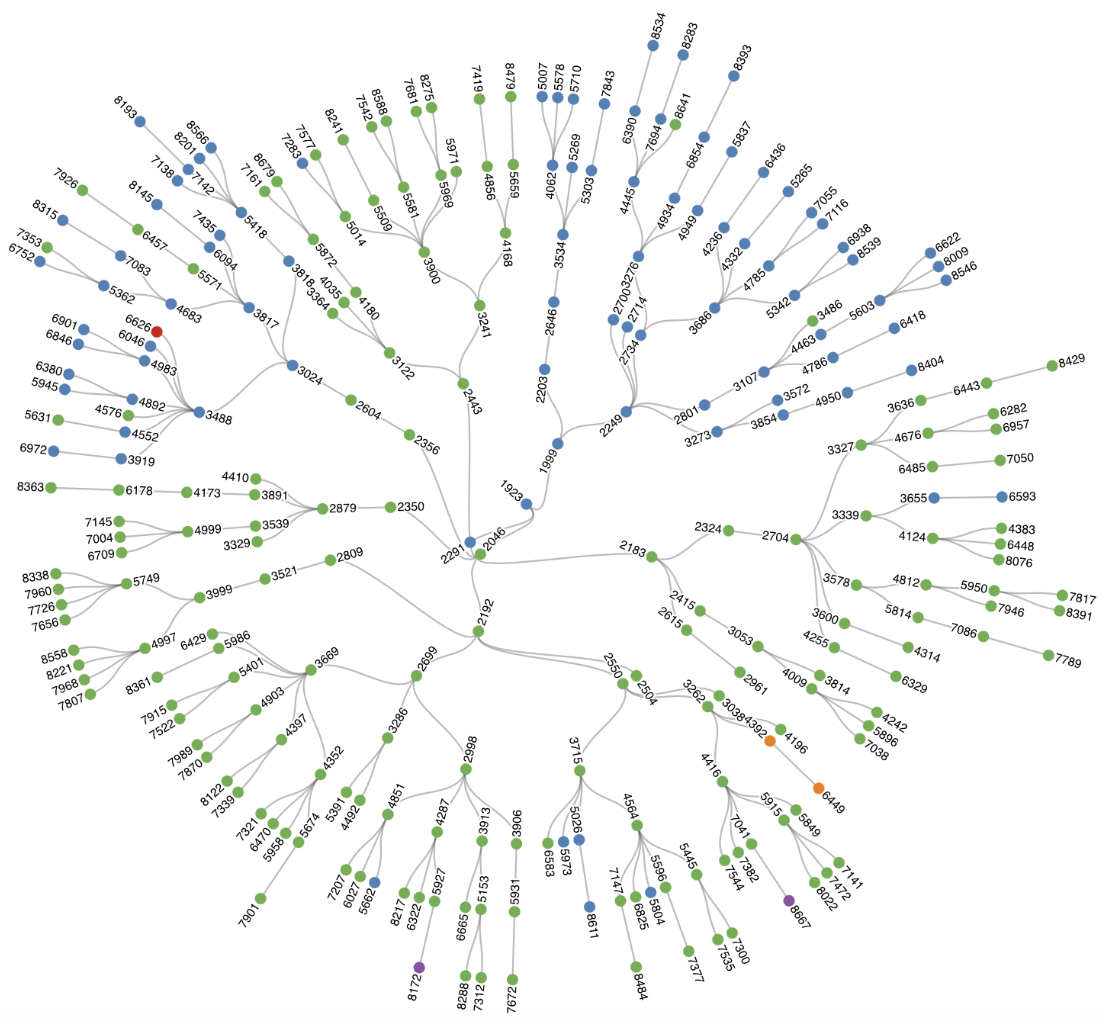
Clusters
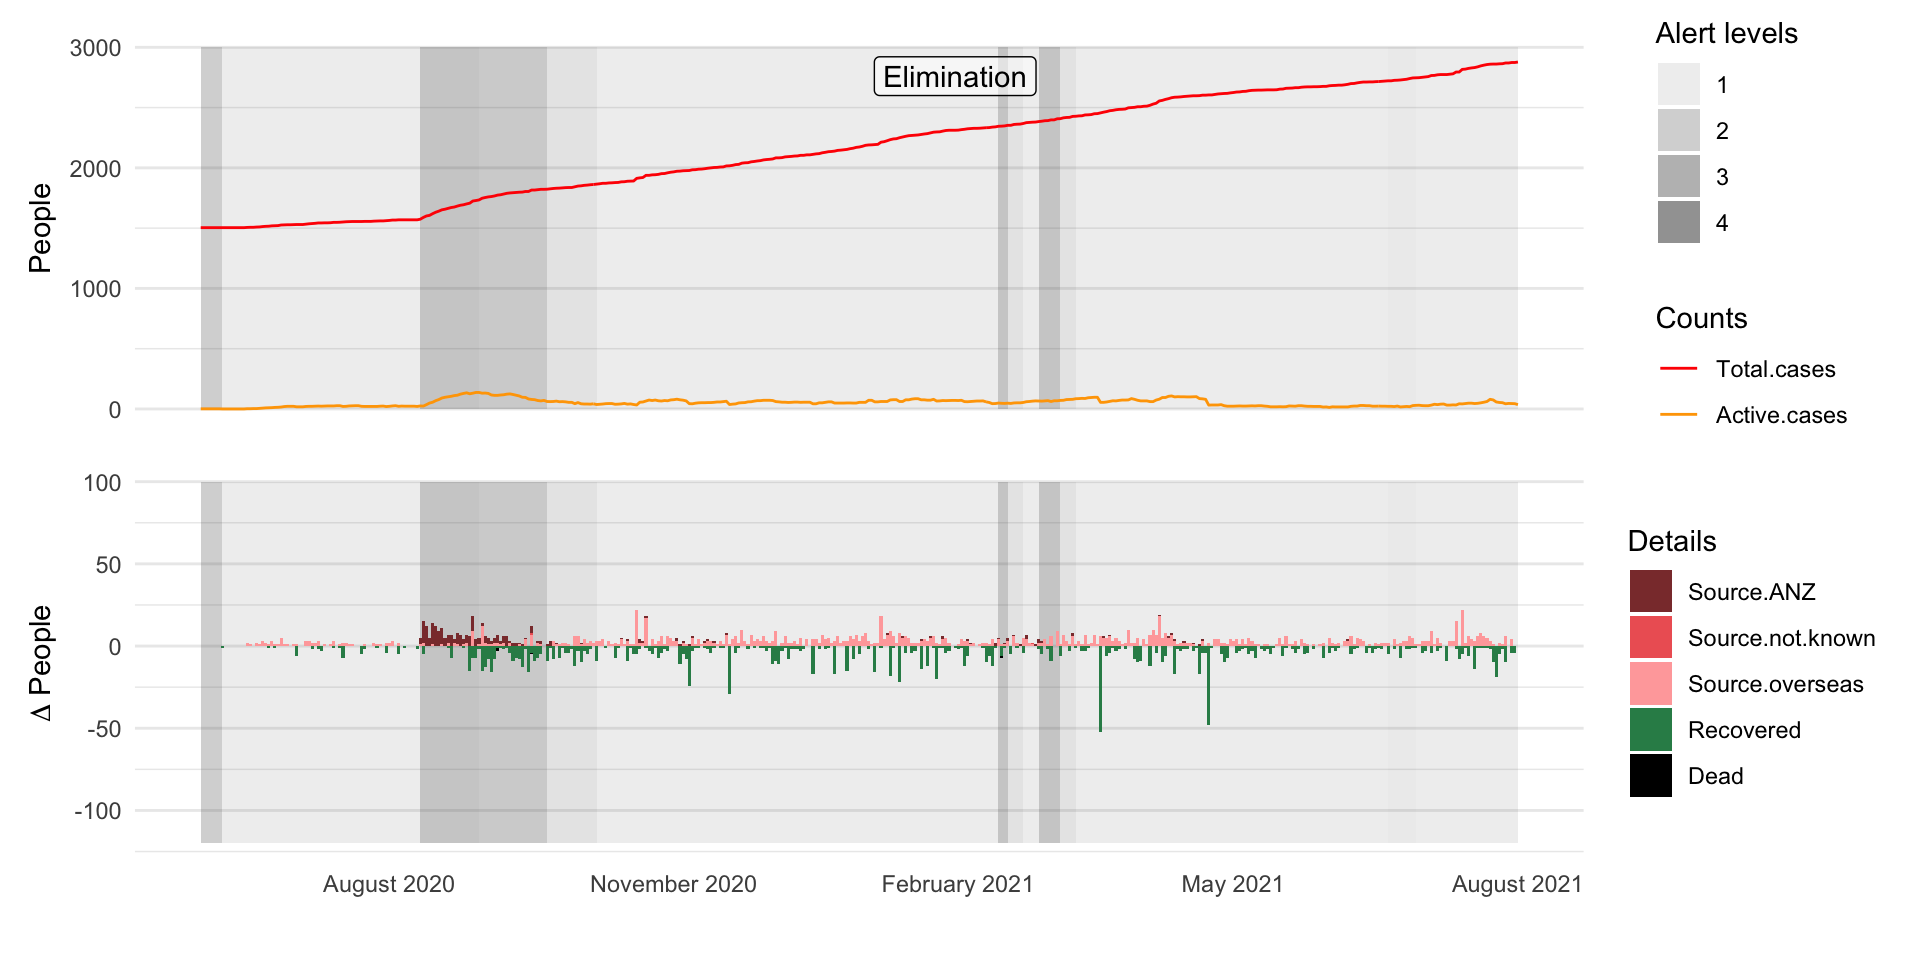
Elimination

On top of the world

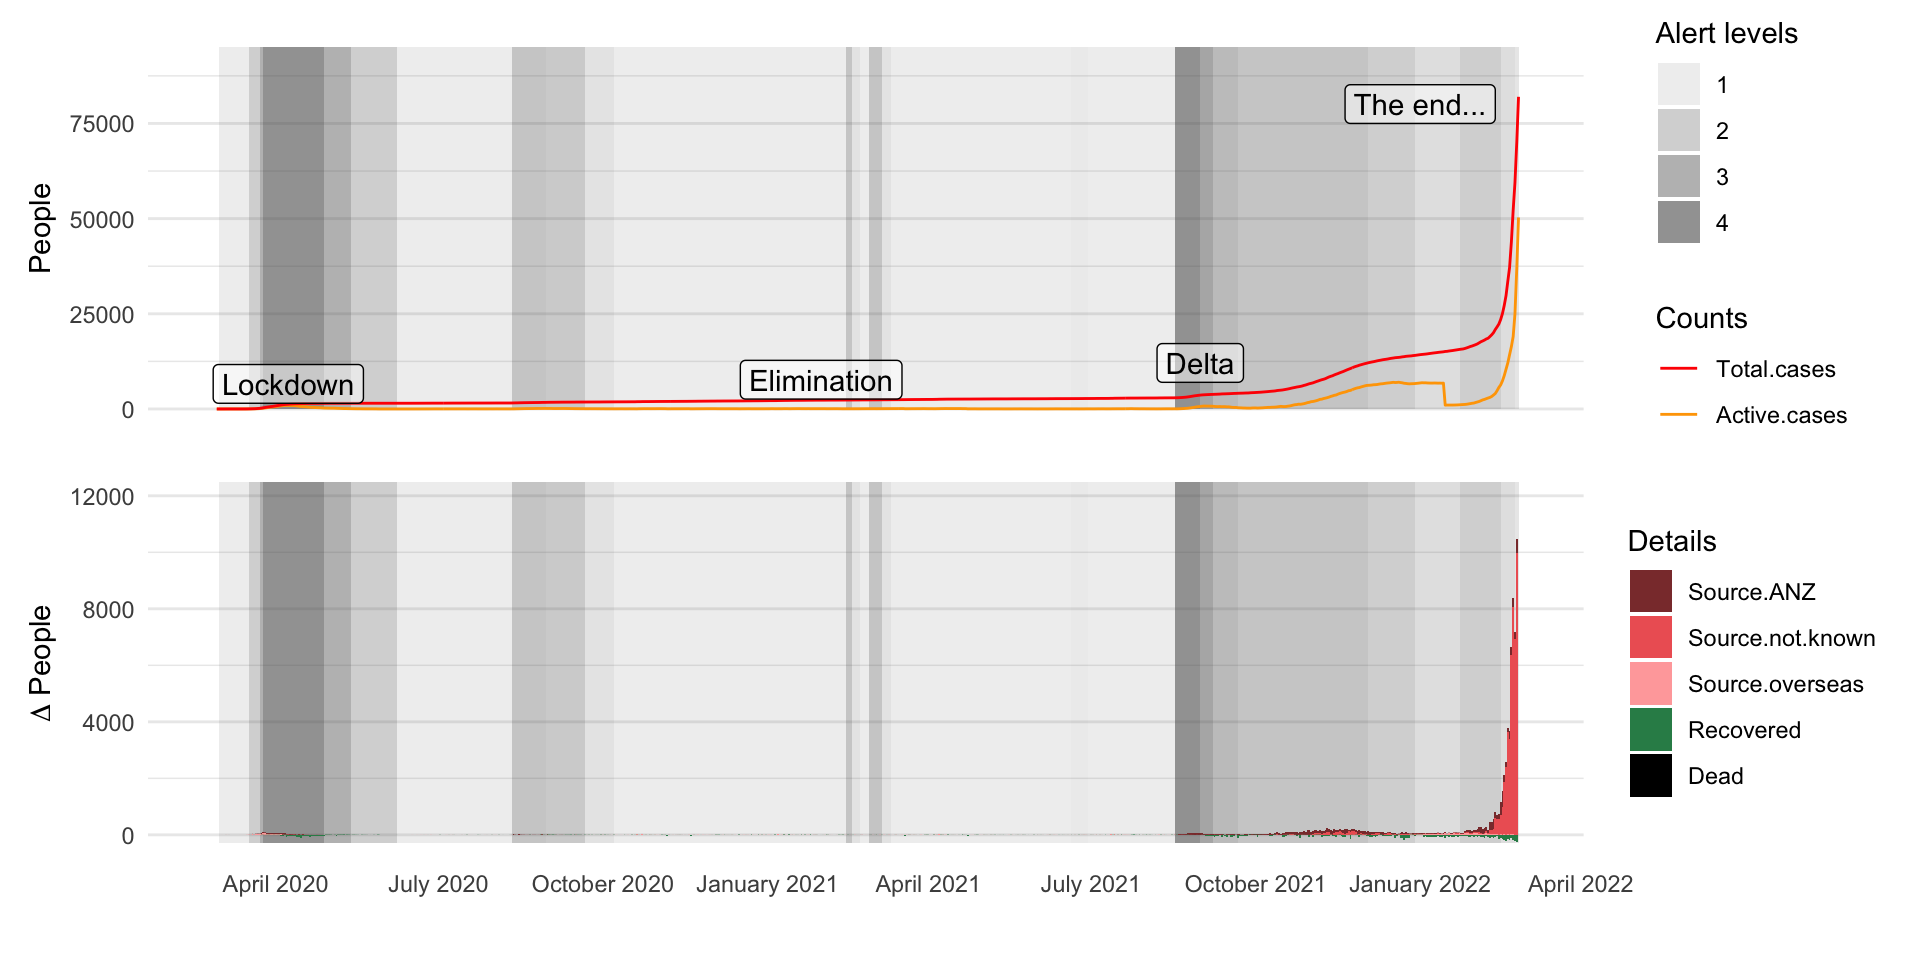
Enter Delta

Also: Omicron

The end…

Reconnecting with the world…

Reflections

Spatial strategies can work in theory…

… but require strong social license

… and timely, accurate data

image source a3traveller.com
statue by Nathan Sawaya

Questions?

Geospatial Stuff
geospatialstuff.com